

As of July 29, 2026. A bottom is only ever visible in the rearview mirror, and Toronto's isn't in the rearview yet — but for the first time in two years, the windshield shows something other than decline. In June, Toronto asking rents rose 1.2 per cent from May, the annual decline narrowed to 1.9 per cent, and the analysts who've charted twenty-one straight months of national declines chose their words carefully: "a possible early signal that rents are stabilizing in Canada's largest market."
That's what stabilization looks like at the moment it begins. It's also what a seasonal head-fake looks like in June. This is the honest mid-2026 read: what the data shows, what it doesn't confirm, and the three tests that will settle it by winter — every number sourced and dated, starting now.
The Toronto Rent Benchmark Table — Mid-2026
Listings data, asking medians, and MLS condo figures side by side in dated columns — with the June signal quoted and the two lenses every figure needs. Revised at every national report.
Get Free PDF →The signal, exactly
Start with the print itself, precisely sourced. Per the Rentals.ca and Urbanation National Rent Report — June data, published July 8, 2026 — Toronto asking rents rose 1.2 per cent month-over-month, and the year-over-year decline narrowed to 1.9 per cent. The same report's national picture: average asking rent of $2,033, down 4.3 per cent annually — the twenty-first consecutive month of annual decline — yet up 0.2 per cent on the month, a third straight monthly rise, which the report attributes partly to seasonal growth. The national backdrop matters for reading Toronto's print: when the whole series rises seasonally, Toronto's 1.2 per cent needs the season subtracted before it means anything — but Toronto's annual gap closing faster than the national one (minus 1.9 against minus 4.3) is the part seasonality doesn't explain, and it's the better half of the signal.
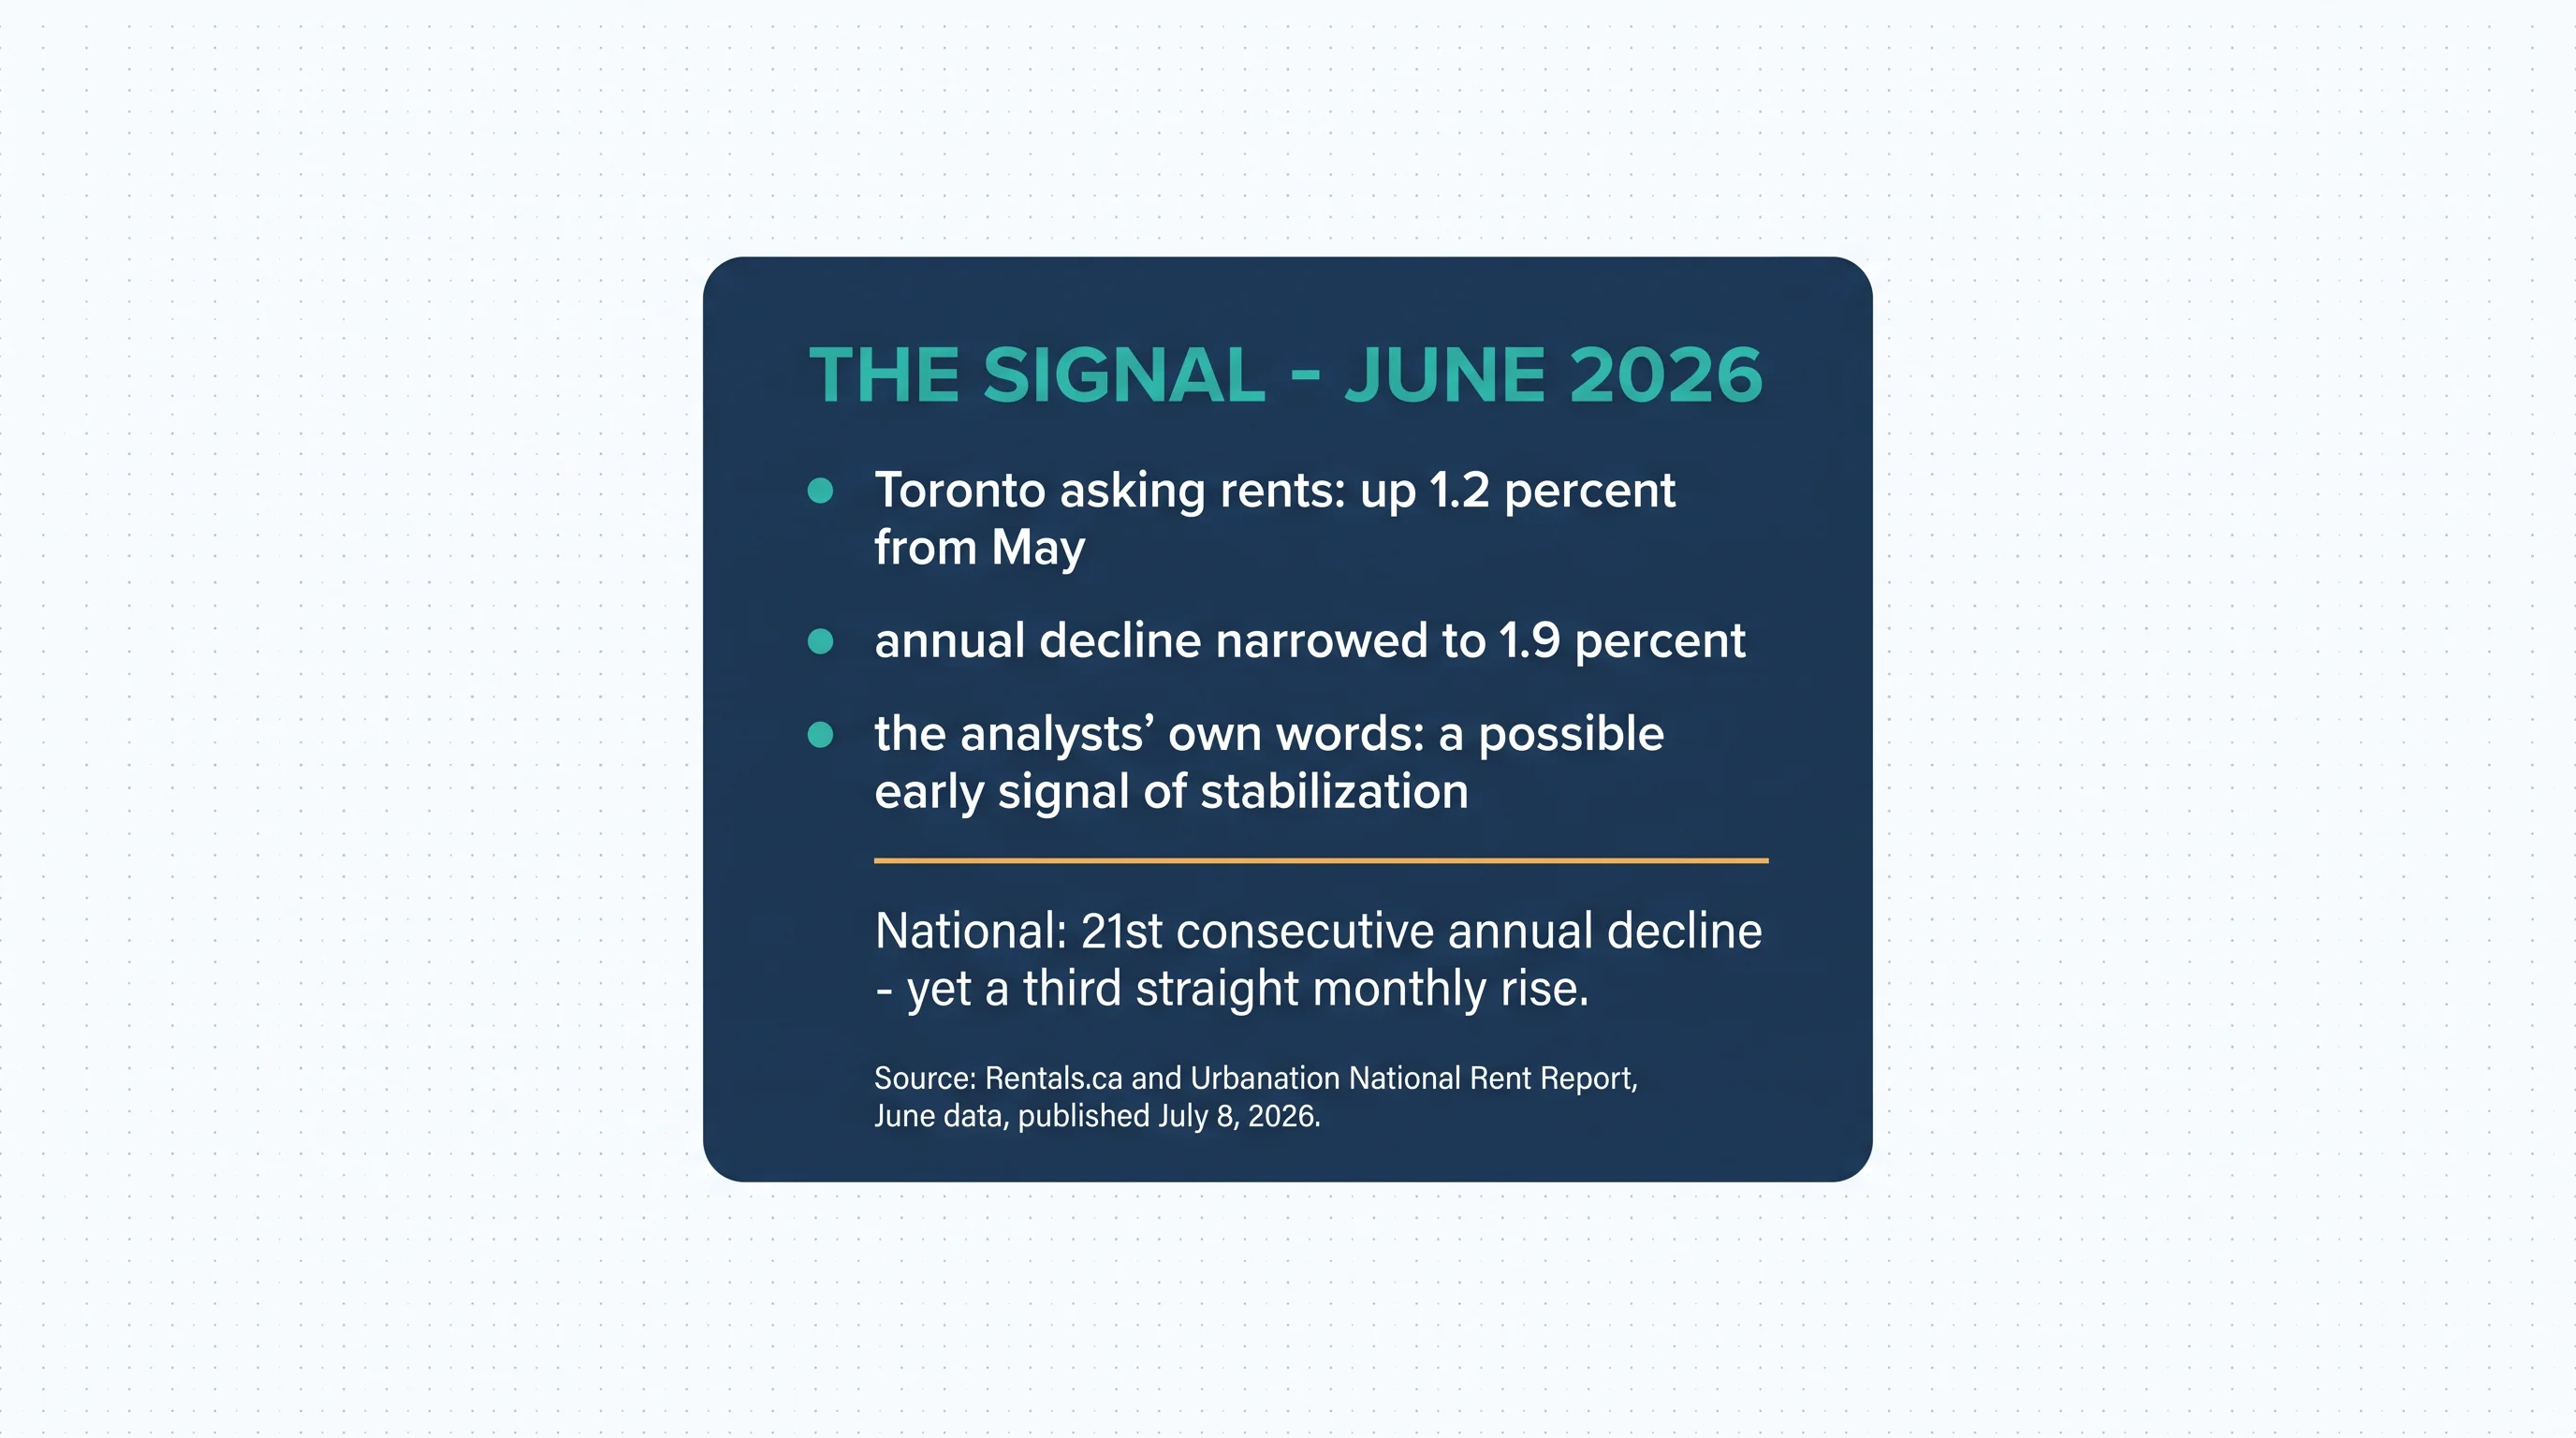
The phrasing matters as much as the numbers. After nearly two years of one-way data, the people closest to the series reached for "possible" and "early" — not "recovery," not "turnaround." This piece takes the same care, because one June print can't distinguish the turn from the season. That distinction is a fall question, and we've named the tests for it below.
Why one print can't carry the verdict: June is structurally the market's friendliest month — leases turn over for September school and job starts, listings meet their annual demand peak, and monthly upticks in early summer have appeared in soft markets before without ending them. What makes this June worth a piece at all is the pairing: a monthly rise and an annual gap narrowing from nearly minus eight to minus two in four months. Either alone is noise; together they're a trend worth testing — which is different, still, from a trend confirmed.
How we got here — the shape of the decline
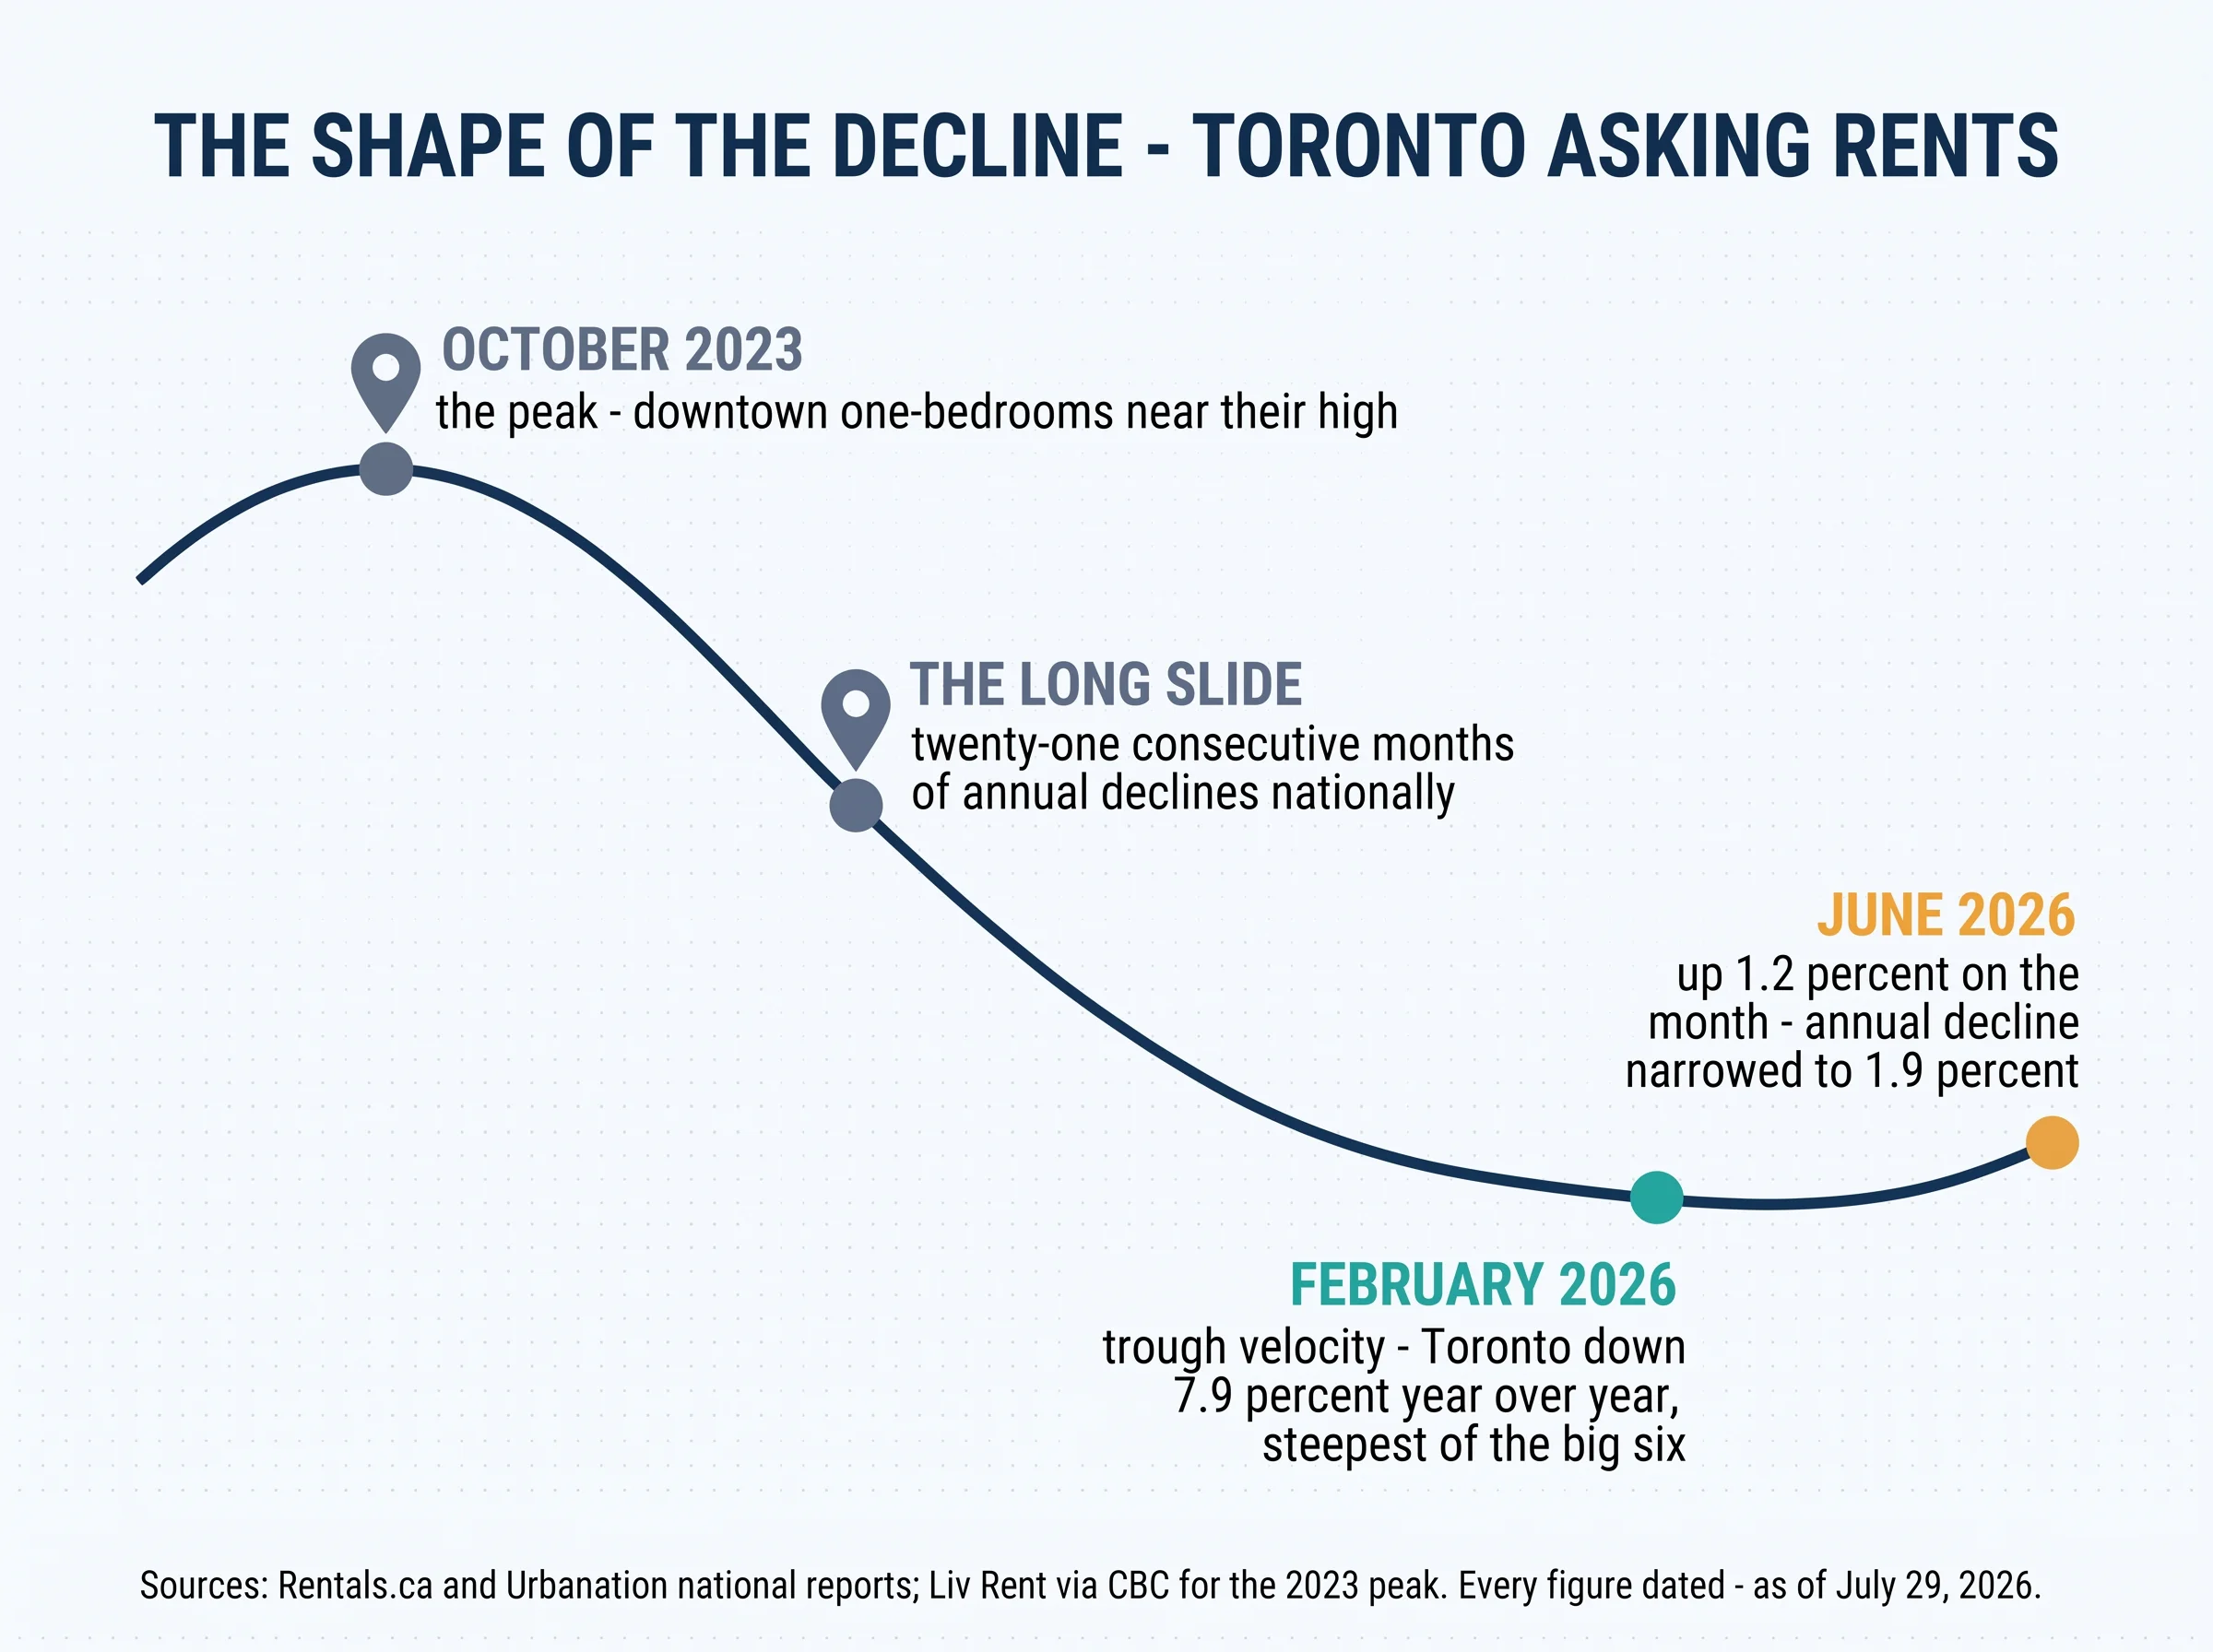
The arc runs from the October 2023 peak — downtown one-bedrooms near $2,600 at the top, per Liv Rent data reported by CBC — through the long slide, to what now looks like the trough's steepest moment: February 2026, when Toronto posted the sharpest declines among Canada's six largest markets — asking rents across all property types down 7.9 per cent year-over-year to $2,482, one-bedrooms down 6.9 per cent to $2,201, two-bedrooms down 7.1 per cent [Rentals.ca series, February data]. From minus 7.9 in February to minus 1.9 in June is a narrowing with a shape — the steep phase, whatever comes next, has clearly ended.
The drivers, attributed where they belong: CMHC's 2026 Mid-Year Rental Market Update (June 9) points to a surge of newly completed, investor-held condominiums entering the rental pool — with supply now outpacing demand for those new units — alongside reduced international-student demand; market reporting adds job-market caution, renters doubling up, and drift from the core to the 905 (where softness followed — Oakville one-bedrooms averaged $2,458, down 4.1 per cent, per March reporting). And the forward-supply fact that frames everything: completions already under construction arrive regardless of any signal. Supply is the known known; analysts quoted this spring expect it to outpace demand through 2026 — the "pendulum," as one broker put it — which makes demand the side where next year gets decided.
One mechanical point keeps the supply story honest: completions are a lagging echo of decisions made years ago. The condos entering the rental pool now were financed and started when rents were climbing toward the 2023 peak; they arrive on construction schedules, indifferent to today's prices. That's why a bottom in a supply-driven decline looks different from one driven by a demand shock — the new units keep coming for quarters after the turn, which is precisely why our third test below watches absorption rather than the completion count itself.
Where rents actually sit — by source, on purpose
Here's a principle this piece won't compromise: different sources measure different markets, so we label every figure and blend none of them. Listings platforms capture what's advertised across all property types; MLS data captures completed condo leases at their own price points. The spread between them isn't noise — it's information about which market you're actually shopping or pricing. A condo tower's one-bedroom and a basement suite in a semi are both "a Toronto one-bedroom," and no honest average of the two describes either; the sources differ because the city does.
Zumper (July 2026, listings-based): Toronto all-types average $2,400 — down 4 per cent year-over-year, flat on the month — with one-bedrooms around $2,120 and two-bedrooms near $2,710. Door Insight (June 2026, asking medians): one-bedrooms $2,150 (down 4.4 per cent), two-bedrooms $2,600 (down 5.5 per cent), three-bedrooms $3,380 (down 6.1 per cent) — with condo two-bedrooms down 7 per cent against house two-bedrooms down 4.9. TRREB (MLS condo leases): Q2 2025 levels ran $2,326 for one-bedrooms (down 5.1 per cent) and $3,066 for two (down 3.5); by Q4 2025, every bedroom category was declining — two-bedrooms down 8.2 per cent — on 13,687 leases (up 16 per cent) against 20,264 listings (up 8.5 per cent); Q1 2026 saw roughly 16,365 leases across the board's area.
And the neighbourhood-cut warning, with the example that makes it stick: one platform's July data shows a Toronto neighbourhood down 74.7 per cent year-over-year — on sixteen rentals. Sixteen listings is a coin flip, not a market. The same caution applies to any eye-popping increase on a thin sample; sample sizes first, always.
The two-track market — asking isn't paying
Whenever someone says "Toronto rents," ask which track they mean, because there are two — and they've been moving differently. Per CMHC's mid-year update, average rents actually paid by all tenants kept rising in most major markets, driven by turnover — units re-let at market after a tenant leaves — with Toronto the exception, where those gains stayed "modest." In the first quarter of 2026, two-bedroom paid rents rose year-over-year everywhere CMHC tracks closely, apart from Toronto.
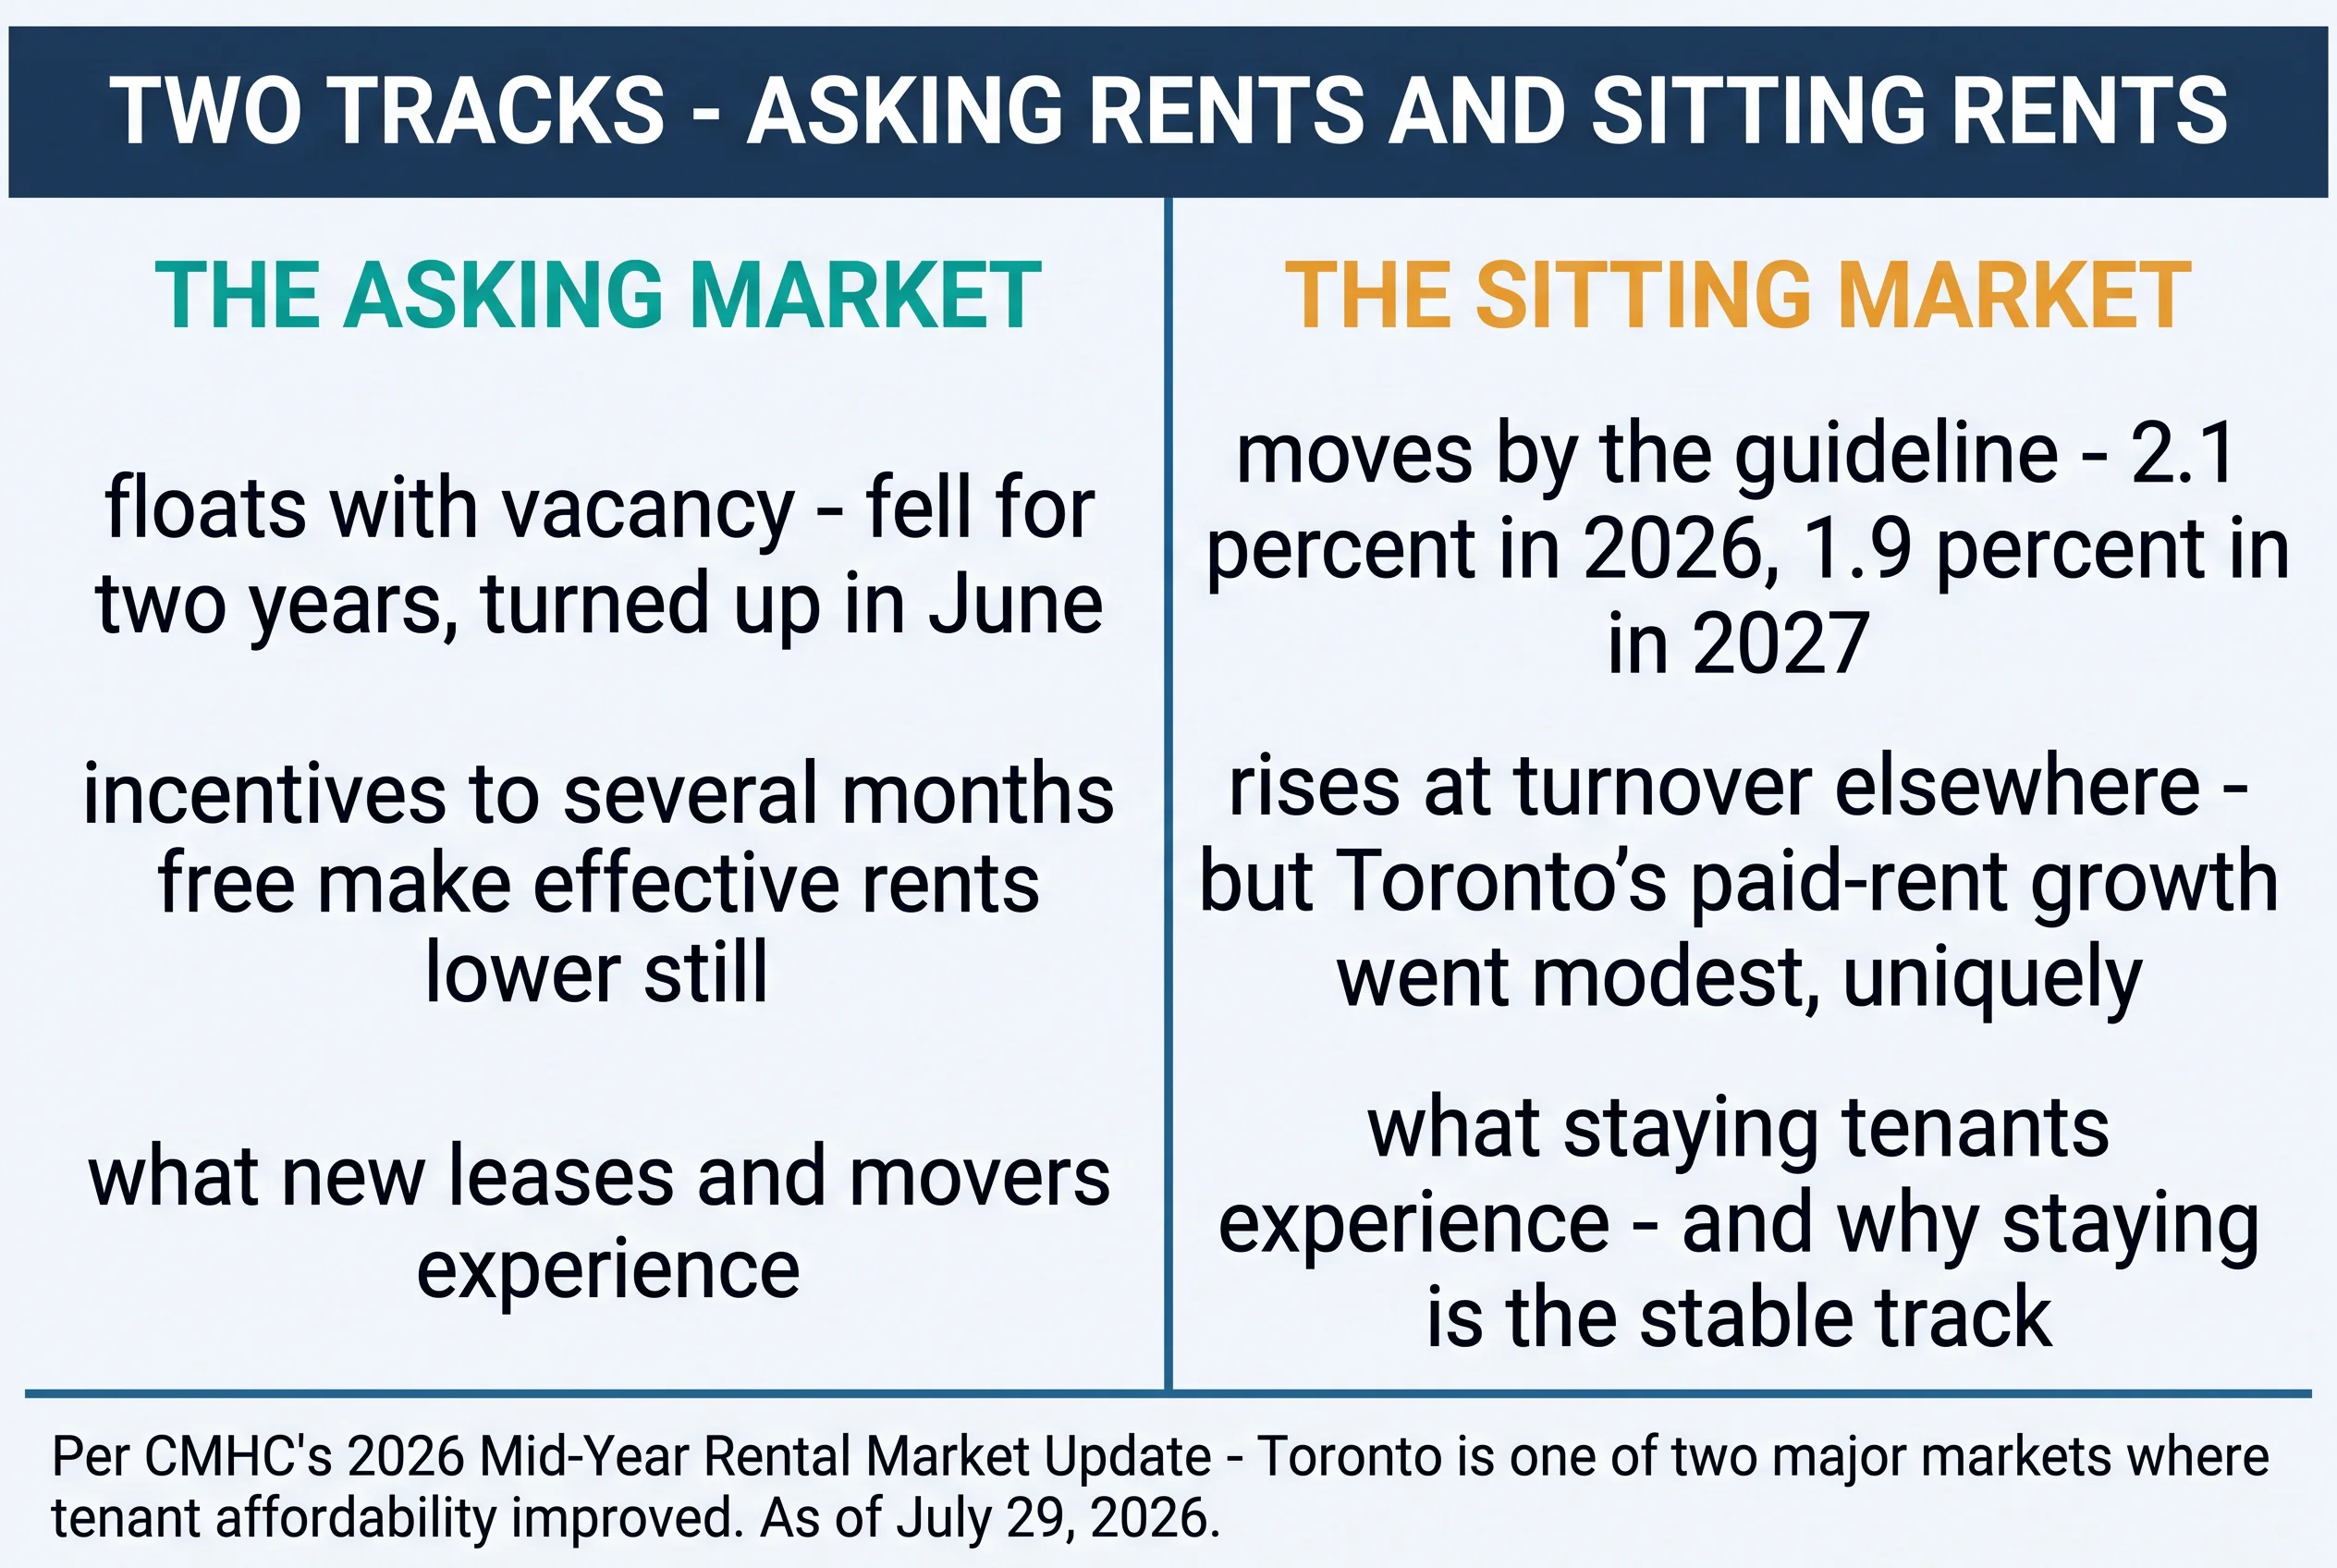
Why the tracks exist takes one paragraph: sitting tenancies in most Ontario rentals move by the provincial guideline — 2.1 per cent for 2026, 1.9 per cent for 2027 — while asking rents float with vacancy. That's vacancy decontrol doing what it does, and it's why a falling asking market narrows the gap between what movers pay and what stayers pay. Toronto's uniquely modest paid-rent growth is that narrowing, visible in national data. It has a practical face on both sides: the tenant who's been sitting since 2022 may now find asking rents within reach of their guideline-grown rent — the move that made no sense in 2023 might pencil now — while the landlord holding a below-market tenancy is watching the "market premium" they'd get at turnover shrink month by month, which quietly changes the arithmetic on how hard to pursue one.
Two more lenses before any number gets used. The incentive lens: asking prices are the sticker, not the street price — CMHC reports concessions intensified over the past six months, running "as high as several months of free rent" plus move-in allowances. Effective rent — asking minus amortized incentives — is the real comparison unit. And the stat nobody markets: per the same CMHC update, tenant affordability in Toronto improved over the past year — one of only two major markets (with Edmonton), on slower rent growth meeting wage growth. A bottoming market is also, briefly, a fairer one — and the mechanism is worth seeing: affordability improves when either rents slow or incomes grow, and Toronto got both at once, a coincidence markets rarely hold for long. If the June signal matures into recovery, the affordability window closes from the rent side; if it doesn't, job-market softness could close it from the income side. Windows in this market are for using, not admiring.
💡 For tenants: The negotiating window is real and measured — incentives run deep, the market shows no urgency, and annual changes remain negative. Use it in effective-rent terms: ask for the incentive explicitly, amortize free months across the lease when comparing (a $2,300 unit with one month free beats a $2,200 unit without), and if June's pattern holds, expect the window to narrow from the edges — the deepest discounts go first, not the whole market at once.
The three tests — what confirmation would look like
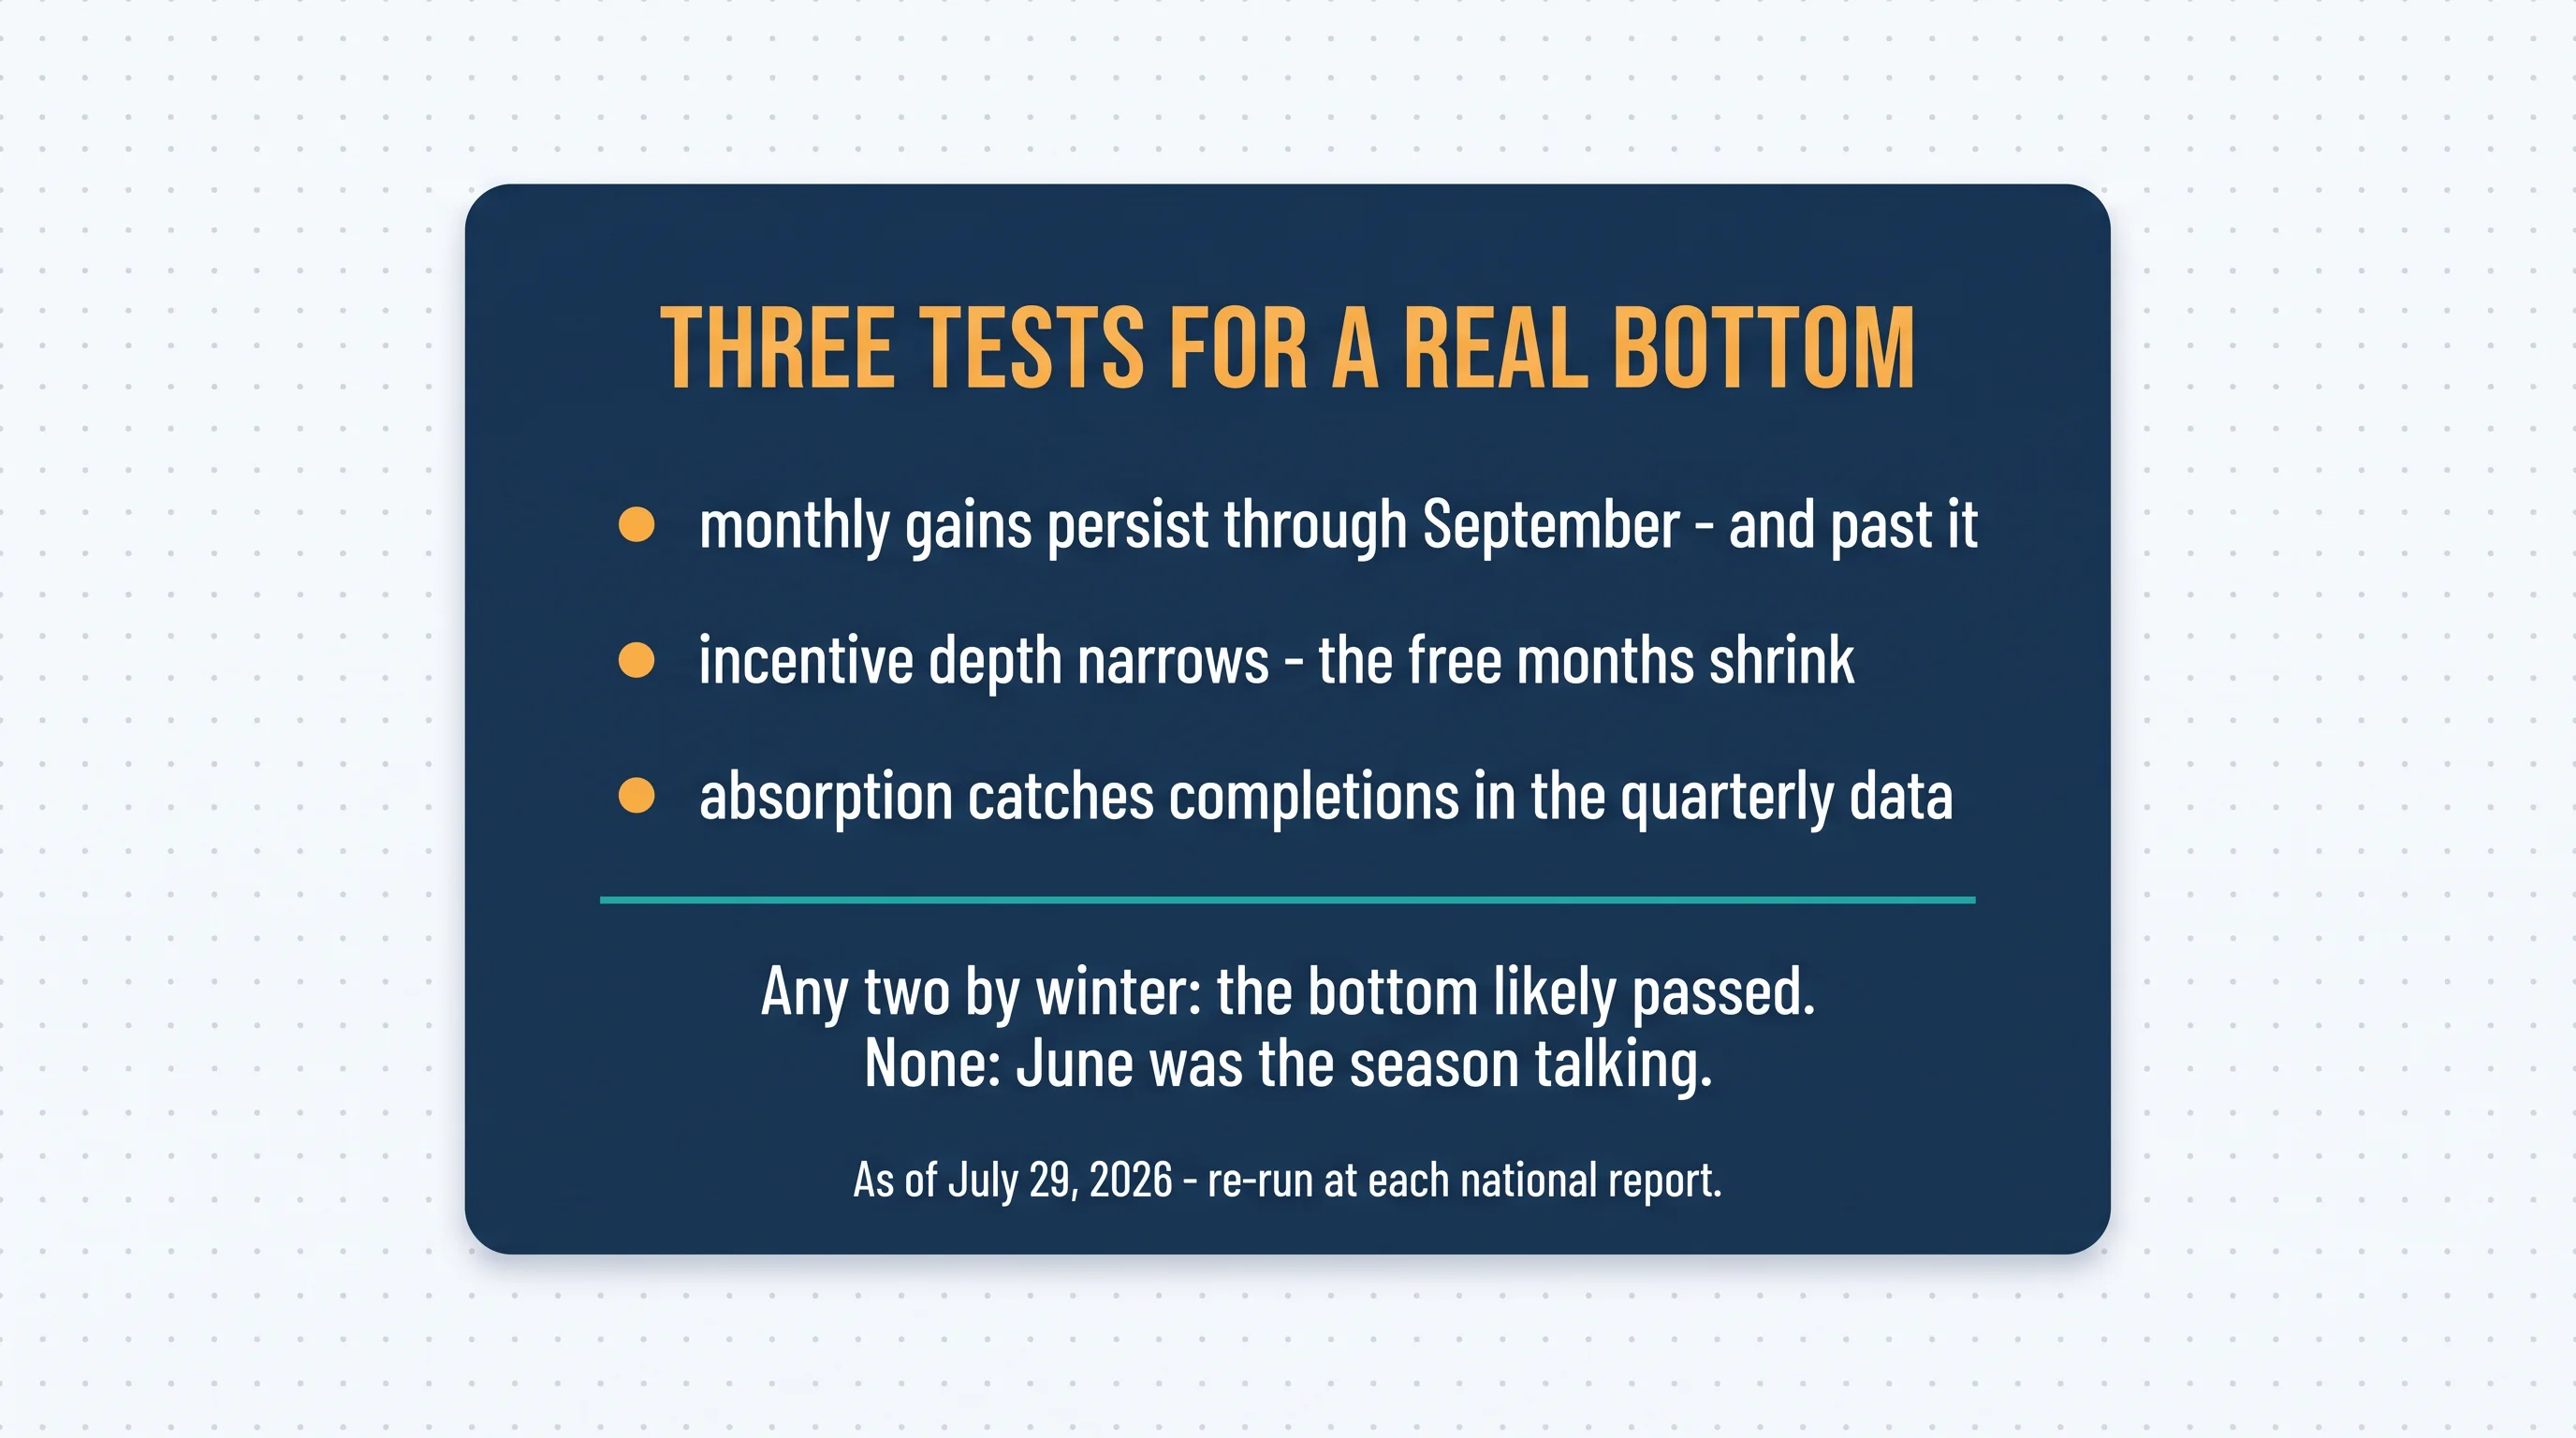
Test one — persistence. June rises are seasonal until October says otherwise. The signal confirms only if the monthly gains hold through September's back-to-school peak and past it, when the seasonal tailwind dies.
Test two — incentives narrowing. Asking prices stabilize first; effective rents confirm. Watch the free months shrink in CMHC's market intelligence and in listing behaviour — a market that still needs three free months to lease hasn't found its floor, whatever the asking print says.
Test three — absorption catching completions. The quarterly data showing new supply actually leasing at pace, instead of stacking incentives to move. Supply will keep arriving; the question is whether demand meets it.
The scoring, honestly: any two by winter, and the bottom was probably behind us by the time we could say so. None, and June was the season talking. We'll re-run this piece at each national report either way. The tests are ordered by how fast they'll speak: persistence shows up monthly in the national series; incentive depth surfaces in CMHC's periodic market intelligence and in listing behaviour you can watch yourself; absorption is quarterly and slowest — which is why an early-winter verdict will rest most on the first two, with the third confirming or complicating it into 2027.
What to do with a maybe

💡 For landlords: Price to the market that exists — not 2023's, not the one you hope is coming. Benchmark by source and month against your actual segment, treat incentives as the price mechanism they are (a free month costs less than a vacant one), and above all keep the tenants you have: turnover into a soft asking market is the expensive move, and the two-track data says sitting tenancies are the stable track right now. Re-check quarterly; the tests above tell you when the calculus changes.
💡 For investors: Frameworks, not timing calls. Underwrite effective rents, never asking; know the three floors — asking rents, effective rents, and valuations bottom separately, often years apart; the completions pipeline is visible through 2026 per the analysts quoted above; and a pro-forma built on the June signal alone is built on one data point. Nothing here is investment advice — it's the discipline that makes advice unnecessary.
💡 Whatever the market does, your ledger should know your numbers: current rents, renewal dates, concessions granted, effective rates — so pricing decisions run on your data plus the market's, not memory. That's the rent ledger Tenon10 keeps as you go. Free for up to 3 units, tenants free on every tier. Create a free account or see current plans.
The Toronto Rent Benchmark Table — Mid-2026
Listings data, asking medians, and MLS condo figures side by side in dated columns — with the June signal quoted and the two lenses every figure needs. Revised at every national report.
Get Free PDF →Key takeaways
- June 2026 delivered the first credible stabilization signal in two years: Toronto asking rents up 1.2 per cent on the month, the annual decline narrowed to 1.9 per cent [Rentals.ca/Urbanation, June data].
- Signal isn't confirmation: the steep phase (February's −7.9 per cent) has clearly ended; the bottom is not yet callable, and the honest analysts say "possible."
- Levels differ by source because sources measure different markets — label, don't blend, and mind the sixteen-listing neighbourhood cuts.
- Two tracks: asking rents float while sitting rents move by guideline — and Toronto's paid-rent growth went modest, uniquely, as the decontrol gap narrowed.
- Incentives to several months free make effective rents softer than asking — negotiate, price, and underwrite in effective terms.
- Three tests settle it by winter: persistence past September, narrowing incentives, absorption catching completions — any two and the bottom likely passed.
One calendar note ties this to the rest of the year: the fall is also renewal season's on-ramp — October 3 opens the N1 window for January 1, 2027 increases at the new 1.9 per cent guideline. A landlord weighing a guideline increase against a soft asking market, or a tenant weighing a renewal against what's listed down the street, is doing exactly the two-track math above — and the fall prints will land right in the middle of those decisions. We'll have the N1 timing guide out well before the window opens.
Signal, not verdict
The market that spent two years teaching Toronto humility is not going to announce its bottom with a press release — it will confirm it the slow way, through a fall of persistent prints, shrinking free months, and buildings that lease without begging. June gave the first entry in that ledger, and the honest position holds both truths at once: the decline's steep phase is over, and the turn is not yet proven. Tenants still hold a real window; landlords should price to what exists and keep who they have; and everyone — including us — should re-check at the next report, because a market check that doesn't expect to be re-run isn't honest about markets. As of July 29, 2026.
Your numbers, beside the market's
Rent ledgers, renewal dates, and concessions tracked as you go — so every pricing decision runs on data, not memory. Free for up to 3 units.
Free for up to 3 units • Tenants always free • See current plans
Related resources
- What Rent Can I Charge? — the benchmark method, province-wide.
- Ontario's Rent Increase Guideline — the sitting-track rules, including 2027's 1.9 per cent.
- Vacancy Rates by Ontario City — the demand side, city by city.
- Best Ontario Cities to Buy — the pillar this market check feeds.
Frequently asked questions
Are Toronto rents going down in 2026?
Asking rents remain below last year — down 1.9 per cent annually as of June — but the monthly direction turned positive (up 1.2 per cent May to June), and the steep-decline phase from early 2026 (February's −7.9 per cent) has clearly ended. Whether June marks the bottom depends on the fall data.
What's the average rent in Toronto right now?
It depends which market you measure: July listings data shows roughly $2,120 for a one-bedroom and $2,710 for two; June asking medians ran $2,150 and $2,600; MLS condo-lease averages run higher. Always note the source and month — and remember incentives make effective rents lower than asking.
Why are Toronto rents falling?
Per CMHC's mid-year update and market analysts: a surge of newly completed, investor-held condos entering the rental pool with supply outpacing demand for those units, reduced international-student demand, job-market caution, and renters doubling up or moving outward.
Is now a good time to rent in Toronto?
The negotiating window is real: incentives run as deep as several months free, the market shows no urgency, and annual changes remain negative. If stabilization holds, the deepest discounts narrow first — compare effective rents (asking minus amortized incentives) and ask for the incentive explicitly.
Will Toronto rents go back up?
Nobody knows, and the honest analysts say "possible early signal," not "recovery." Watch the three tests: monthly gains persisting past September, incentives narrowing, and new supply actually being absorbed. Any two suggest the bottom passed; none suggests June was seasonal.


