

Ask ten people to name the best Ontario city to buy a rental property and you'll get ten confident answers. Here's the honest one: the question is wrong. The same $700,000 buys a downtown Toronto condo yielding maybe 3.5% gross, a Hamilton Mountain duplex near 5.5%, or two London townhouse units around 6%. Same capital. Three completely different businesses — different tenants, different rules, different risks, different reasons to own them.
Most "best cities" lists won't tell you that, because most of them are realtor hype or renter livability rankings — none built for the person signing the mortgage. And 2026 is a genuinely unusual year to be choosing: Ontario's benchmark price is down 4.6% year-over-year (OREA/CREA, June 2026), vacancy has loosened into balanced territory, turnover rents have cooled — and underneath the soft year sits a projected ~207,000-unit structural rental deficit by 2034. This guide is the landlord's scorecard: vacancy, rents, prices, yields, property taxes, demand drivers, and the local rules layer, city by city, every figure sourced and dated — plus the strategy matcher that turns the data into a shortlist, and the honest rows where the answer is "be careful." It's general information, not investment advice: the scorecard organizes the questions; your broker, accountant, and your own numbers answer them.
The Ontario City Scorecard: 20 Checks Before You Buy a Rental in Any Market
Run any Ontario city through the same underwriting discipline the pros use — vacancy, rents, yields, taxes, and the rules layer most scorecards skip — before a dollar moves.
Get Free PDF →The 2026 Frame: What Kind of Market You're Buying Into
Start with prices, because they set every yield you'll compute. Ontario's MLS Home Price Index composite benchmark sat at $753,300 in June 2026, down 4.6% year-over-year, with the average resale price at $831,595 (OREA/CREA). The correction has been steepest exactly at the affordable end: the benchmark condo price fell 8.5% over the year to $493,200 — Toronto condos now sit roughly 25% below their 2022 peak — while townhouses dropped 7.2% to $597,100 and single-family homes held better at $836,900. Toronto, Ottawa, and London are in buyer's-market territory with elevated inventory, and the Bank of Canada has been holding at 2.25%. The landlord's read on all of it: the entry price fell hardest exactly where rents softened most. The condo discount and the condo carry problem are the same fact, and any scorecard that celebrates one without pricing the other is selling you something.
Now rents. The canonical data source here is CMHC's Rental Market Survey — conducted each October, published each December, so the current vintage is October 2025 (published December 2025), with the next refresh due December 2026. Its story, echoed by CMHC's 2026 outlook: Ontario has moved from scarcity to balance. Weak renter-household formation (student-permit caps, lower immigration targets) met a purpose-built supply wave — Ottawa's largest rise in new rental supply in roughly 50 years — and provincial vacancy is settling in the 3–5% range through 2026. Turnover rents for two-bedroom units actually fell in most major centres. Translation for buyers: 2026 is an acquisition-window year for disciplined underwriters, not a rent-growth year — and once you own, retention economics beat repricing, which is why a turnover system that protects occupied weeks matters more in a balanced market than it ever did in a tight one.
And the thesis underneath the soft year: Ontario is projected to need roughly 418,000 rental units by 2034, with only about 211,000 expected to be built — a ~207,000-unit structural deficit. Today's balance is a window, not the weather. Both things are true at once, and the scorecard holds them both.
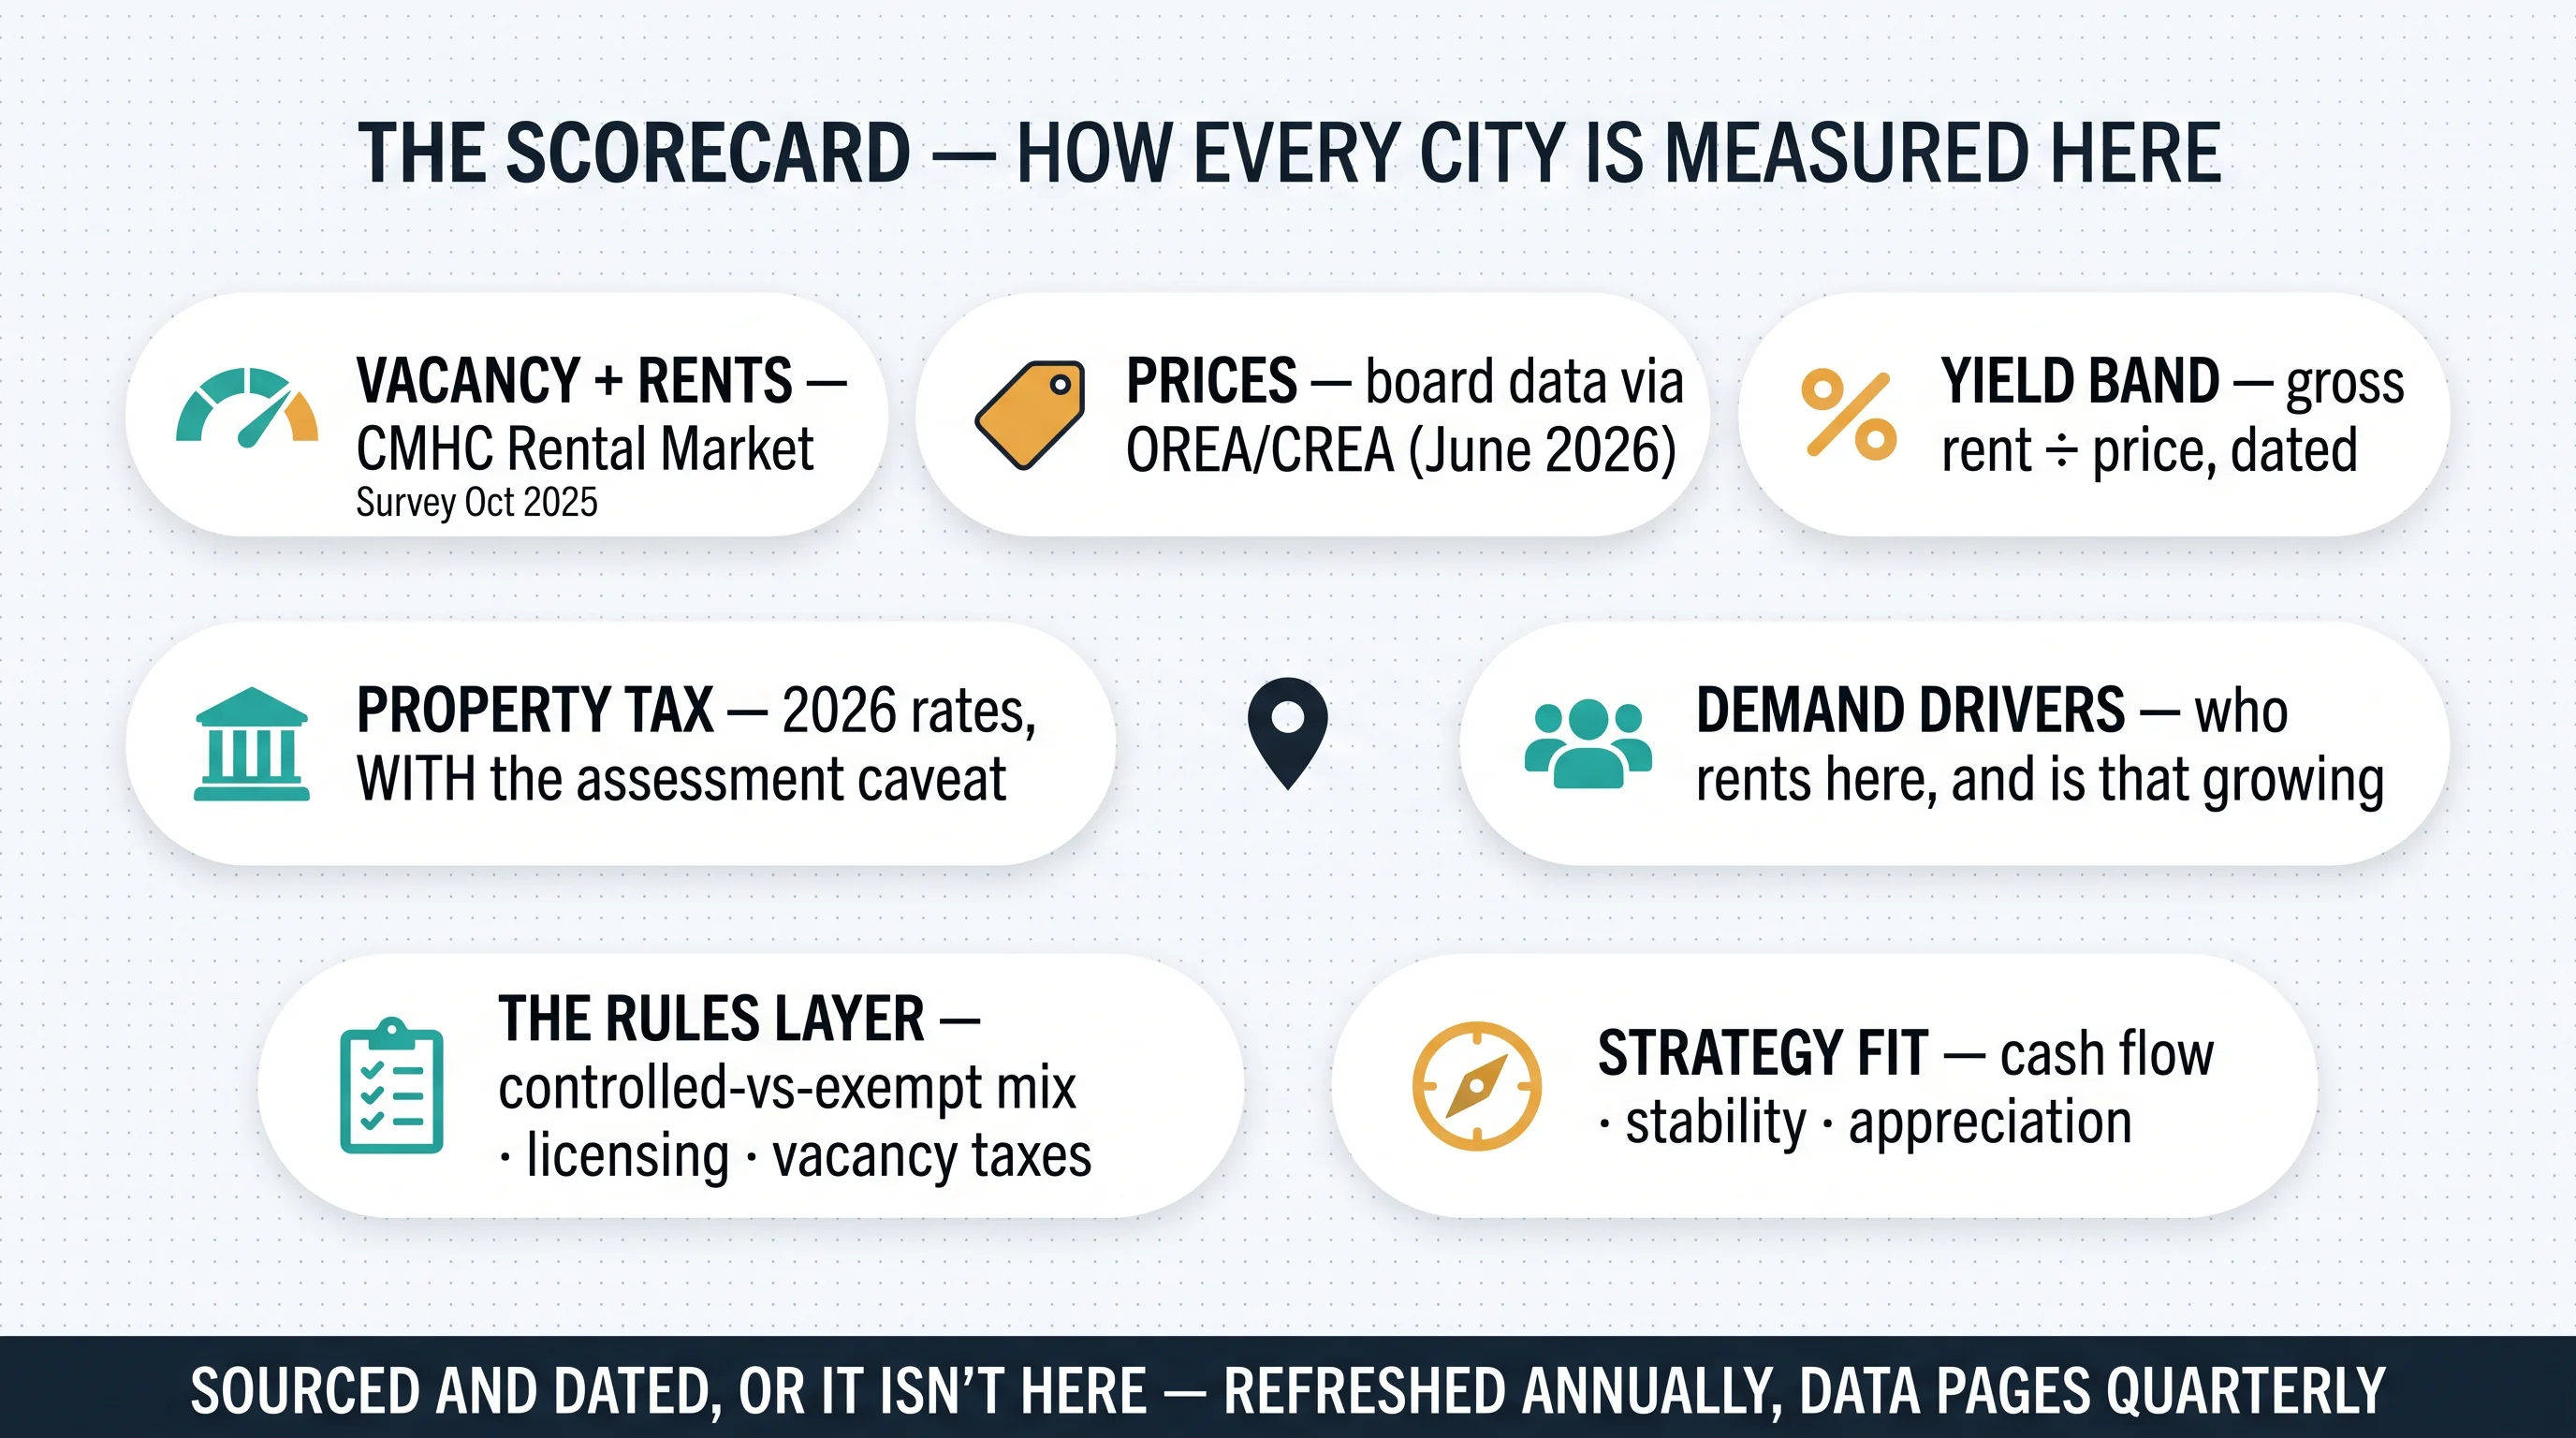
Methodology — sourced and dated, or it isn't here: every city below is measured the same way: CMHC vacancy and average rents (Oct 2025 survey, published Dec 2025), prices from local boards via OREA/CREA (June 2026), a gross-yield band (annual rent ÷ price), 2026 property-tax rates with the assessment caveat, demand drivers, the rules layer, and the strategy the numbers fit. This pillar refreshes annually; its companion data pages — cap rates, rent benchmarks by bedroom count, and the full tax comparison — refresh quarterly. If a figure has no source and no date, it didn't make the page.
If you're earlier in the journey than city-picking — still deciding whether a rental property belongs in your life at all — start with the first-timer's guide to becoming a landlord and the three-sets-of-numbers discipline in our buying-your-first-rental guide; this scorecard assumes you've decided to shop and want to know where.
The City Rows: Six Markets, Matched to Strategy
No ranking theatre here — a matcher. Each row tells you what the city sells, what it costs, and which strategy its numbers actually fit.
Toronto — the liquidity market
Strategy fit: appreciation and optionality, not cash flow. Average price around $1,009,000 (early 2026), with condos roughly 25% off their 2022 peak. Vacancy hit 3.0% in the October 2025 survey — the first time at that level since the pandemic — and the average purpose-built two-bedroom rents around $2,046. Gross yields on downtown condos run 3.0–4.0%: the math that rarely carries itself at 20% down, which is why Toronto is where equity strategies live and cash-flow-first landlords shop west and south. The tax line surprises people: Toronto has the province's lowest residential rate (~0.67%) — on its highest assessments, plus a Municipal Land Transfer Tax at purchase, Vacant Home Tax declarations every year, and a citywide multi-tenant licensing framework if you're renting by the room. What you're buying is the deepest tenant pool in the country, the fastest re-leasing, and the best exit liquidity in the province. That's worth something. It just isn't monthly cash flow.
Ottawa — the stability market
Strategy fit: low volatility, long holds. Average price around $606,700 — a fraction of Toronto's — on a federal-employment demand base that makes tenancies unusually recession-resistant. The tell: while turnover rents for two-bedrooms fell across most major centres, Ottawa's ticked up. The caveat that keeps this row honest: that ~50-year supply wave is landing right now, so vacancy is loosening from tight — underwrite lease-up timelines realistically rather than assuming yesterday's scarcity. Property tax runs 1.2271% (2026), and Ottawa's Vacant Unit Tax requires an annual declaration whether your unit is vacant or not. Fit: the conservative portfolio's anchor city.
Hamilton — the classic investor market
Strategy fit: cash flow plus GTA-spillover growth. The benchmark sat at $744,000 in May 2026 — down 5.4% year-over-year but up for two consecutive months, a floor visibly forming. Vacancy 3.6%; average rents $1,753 for a one-bedroom and $2,086 for a two-bedroom. The defining feature is the two-market split: guideline-capped sitting tenancies on the older stock versus turnover and secondary-market units resetting to market — turnover rents ran up 12.9% year-over-year into early 2026 before cooling toward 6–9%. Gross yields run 5–6%, and the neighbourhood tiering is where they live: the Mountain, Stoney Creek, and the east end deliver the yields, while Ancaster, Dundas, and Westdale command 20–35% premiums. Demand is layered — GTA migration, McMaster's roughly 36,000 students (about 60% renting off-campus), the hospital sector, GO expansion — and the rules layer includes a rental licensing pilot you should check before you offer. CMHC expects vacancy to peak here in 2026 on record completions: slower rent growth for owners, a value window for patient buyers. Fit: the balanced first portfolio city.
Kitchener–Cambridge–Waterloo — the balance pick
Strategy fit: cash flow plus tech-and-student growth. Gross yields run 4.3–6.5% — strongest on multi-unit — against Toronto condos' 3.0–4.0%. One-bedrooms rent $1,800–2,000 in the core corridors, two-bedrooms $2,200–2,600, with a real premium along the ION line and Stage 2 into Cambridge as the forward bet. Here's the row that teaches the scorecard's biggest lesson: KCW's vacancy sits at a multi-decade high (~3.6%) — and the cheapest rent quartile sits under 1% vacant, with the loosening concentrated in Waterloo's university zone after the student-permit cap. An investor who reads only the headline walks away from the exact submarket that never softened. Supply risk cuts both ways: the Region of Waterloo's infrastructure constraints have paused some development approvals (medium-term protection for incumbent landlords), while the tariff-exposed manufacturing base is the demand risk worth watching. Waterloo's updated licensing bylaw takes effect July 2026 — read it before you buy there. Investor roundups call KCW their consensus #1; this scorecard's verdict is narrower and truer: for balance, deservedly.
London — the value and education market
Strategy fit: affordability-first cash flow. Two-bedroom purpose-built rents run about $1,500 — roughly 27% below Toronto — on entry prices far below the GTA, with buyer's-market conditions on top. Vacancy has eased to 3.5–4% from its 1.4% low in 2023 as new supply landed. Western University drives a 15–25% rent premium in Masonville, Richmond Row, and Medway, with healthcare and education anchoring the broader employment base. The honest ceiling: London's median household income (~$82,000) puts a two-bedroom near the 30% affordability line, which means rent growth has a governor — buy for the yield that exists, not the growth you're hoping for.
Windsor — the yield-with-risk market
Strategy fit: deep value, eyes open. The lowest big-city rents in the province ($1,651 average) on the lowest big-city prices — the spreadsheets look wonderful. The 2026 reality check: vacancy at 3.7% (above the provincial average), international-student renters down two years running, temporary-foreign-worker permits not renewing, tariff and trade-review exposure across the manufacturing base, CMHC market intelligence noting laid-off workers relocating to Alberta — and the province's highest property-tax rates, the mirror image of Toronto's structure. The verdict this row exists to deliver: cheap is not the same as cash-flowing. Demand durability is the underwriting question, and it doesn't appear anywhere on the listing sheet.
The brief rows
St. Catharines–Niagara: improving affordability is helping sales, but rental demand is tempered by fewer intra-provincial migrants — underwrite absorption honestly. Kingston and Barrie: emerging secondary picks — Queen's University demand in one, commuter-belt economics in the other — with thinner liquidity on exit. The 905: post-secondary-area vacancies in Mississauga and Brampton have climbed above 4%; for the first time in years, much of the inner suburbs is a tenant's market, which is a pricing input, not a prohibition.
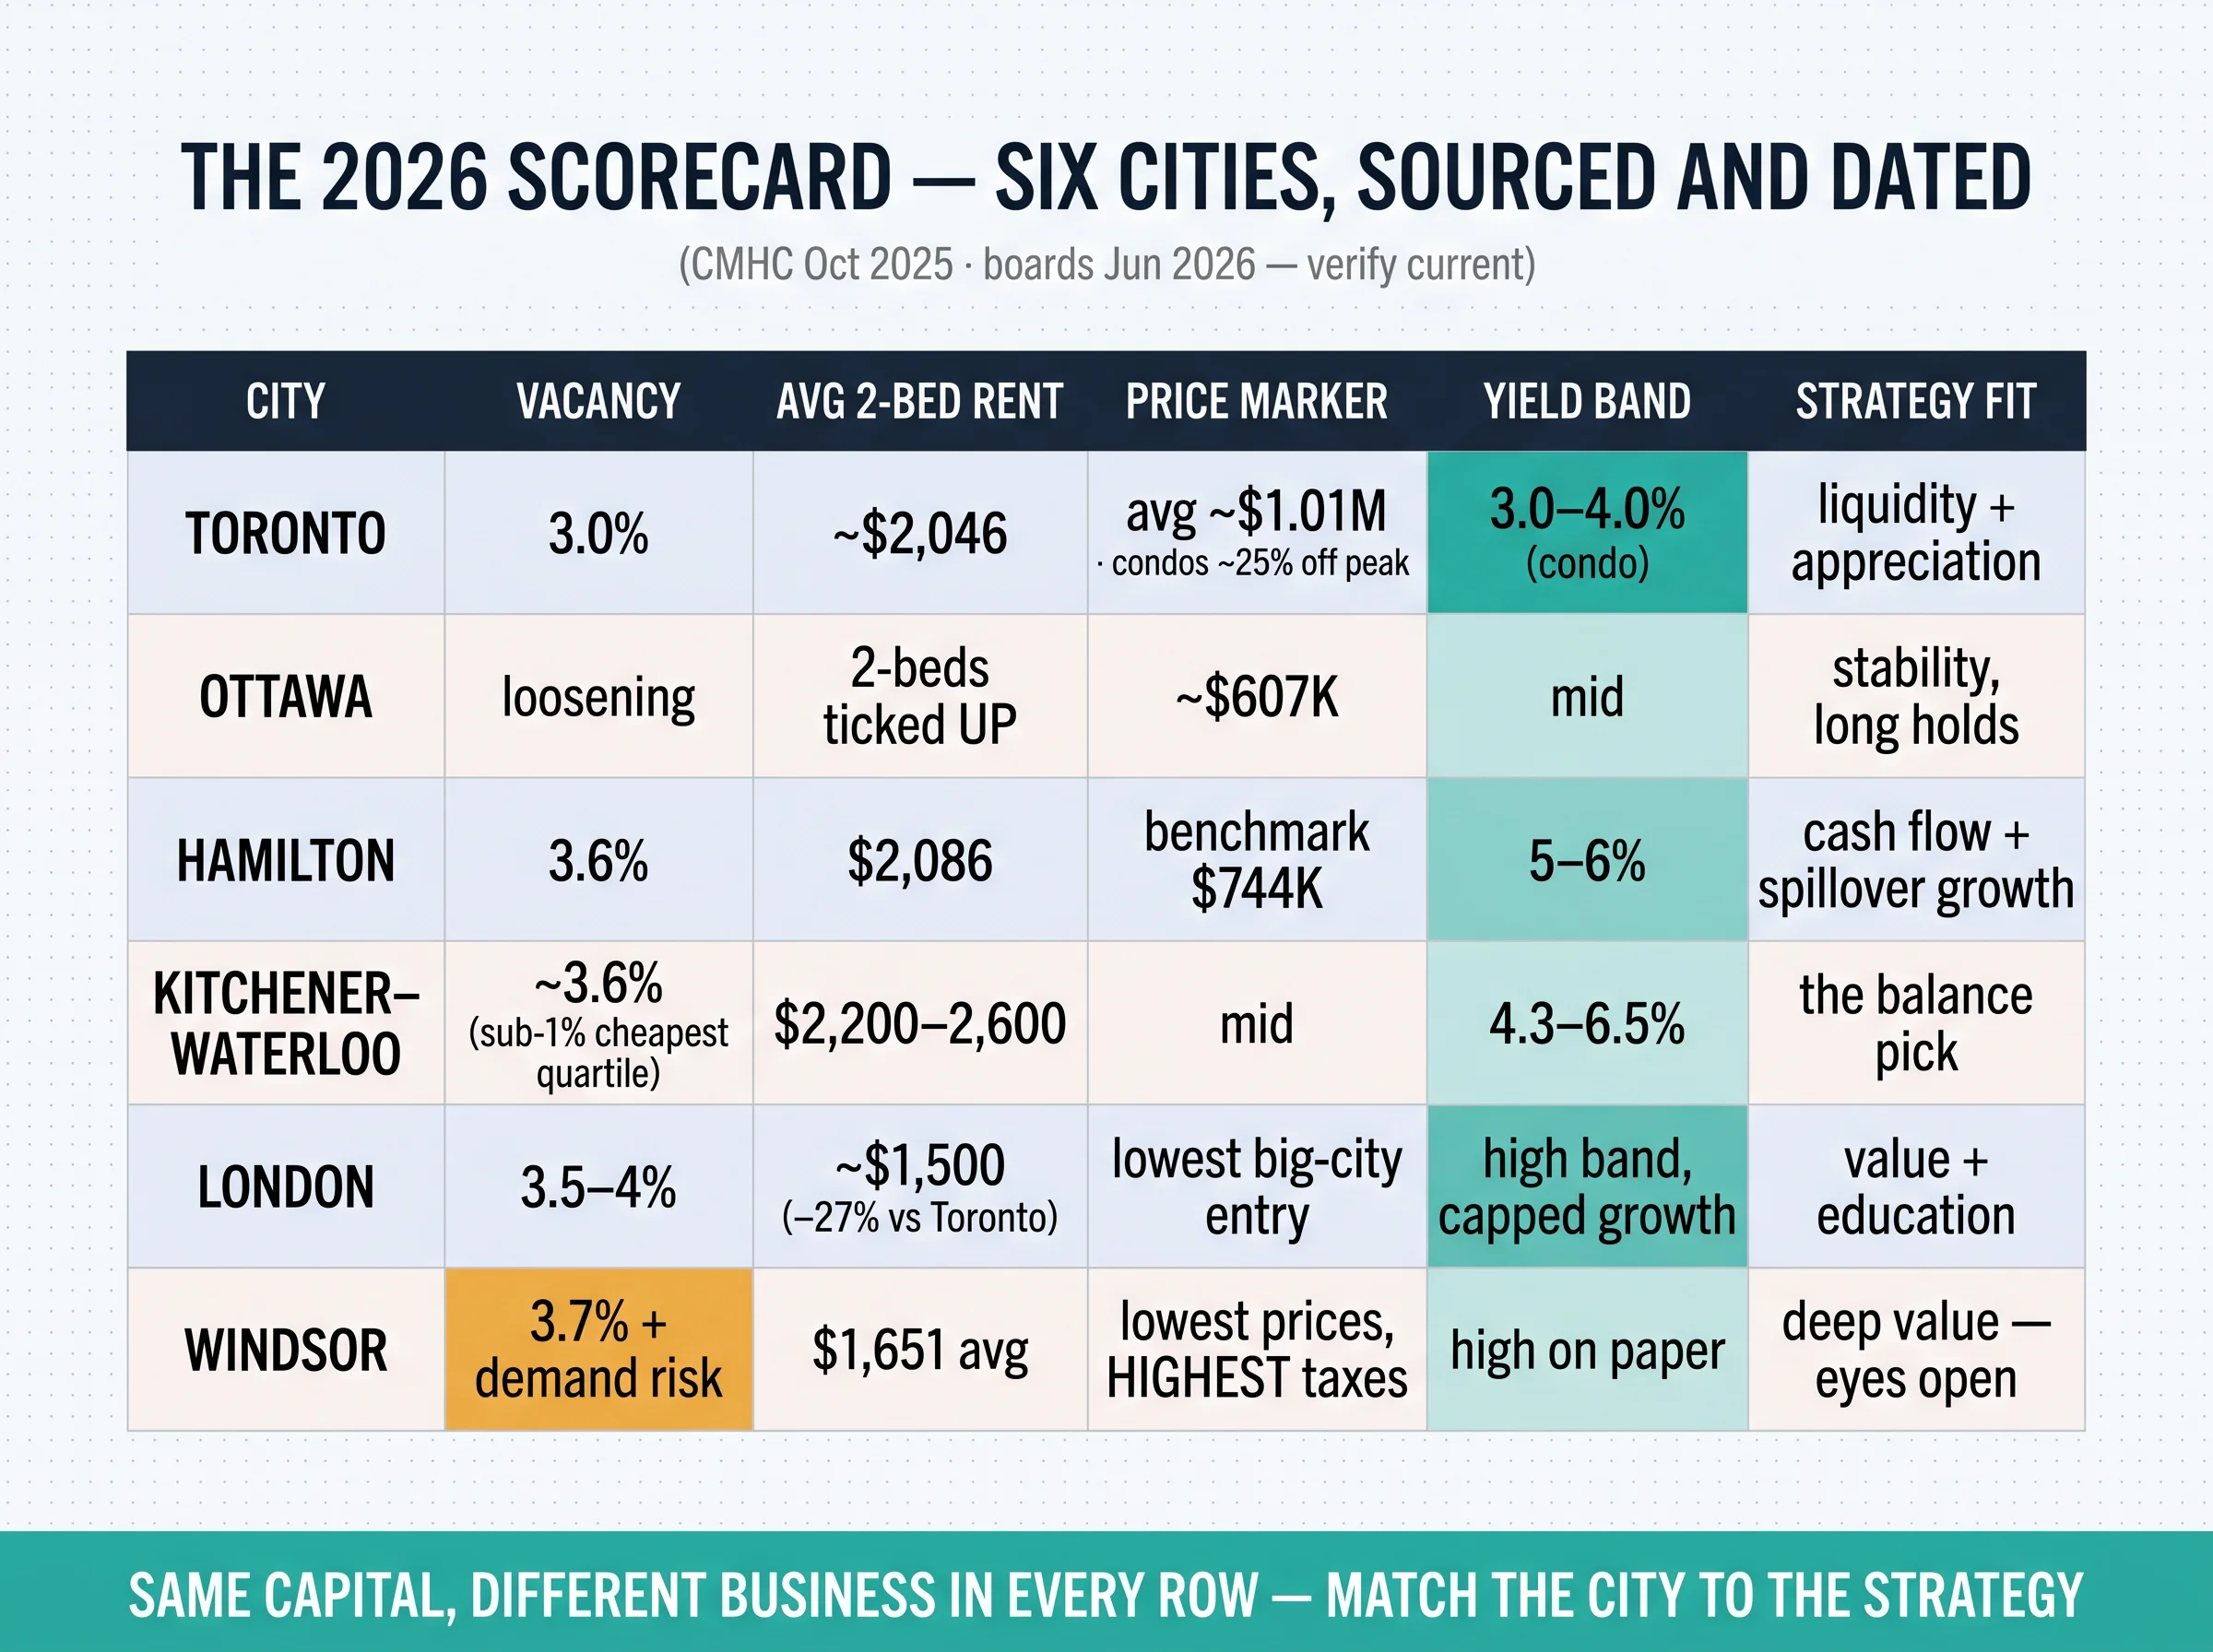
Run the centrepiece math yourself and the thesis stops being a slogan. The same $700,000, June 2026 figures: a Toronto one-bedroom condo yielding around 3.5% gross, banking on appreciation and liquidity; a Hamilton Mountain duplex near 5.5%, cash flow with spillover growth; two London townhouse units near 6%, yield with a rent ceiling. None of these is the wrong purchase. Each is the wrong purchase for the wrong strategy — and the strategy, not the city's reputation, is what your financing, your risk tolerance, and your timeline actually price. Once you're comparing seriously, the deal-level discipline in our first-rental numbers guide and the audit-ready records habit from our CRA rental-income guide are the follow-through.

The Layer Nobody Scores: Ontario's Rules as a Market Variable
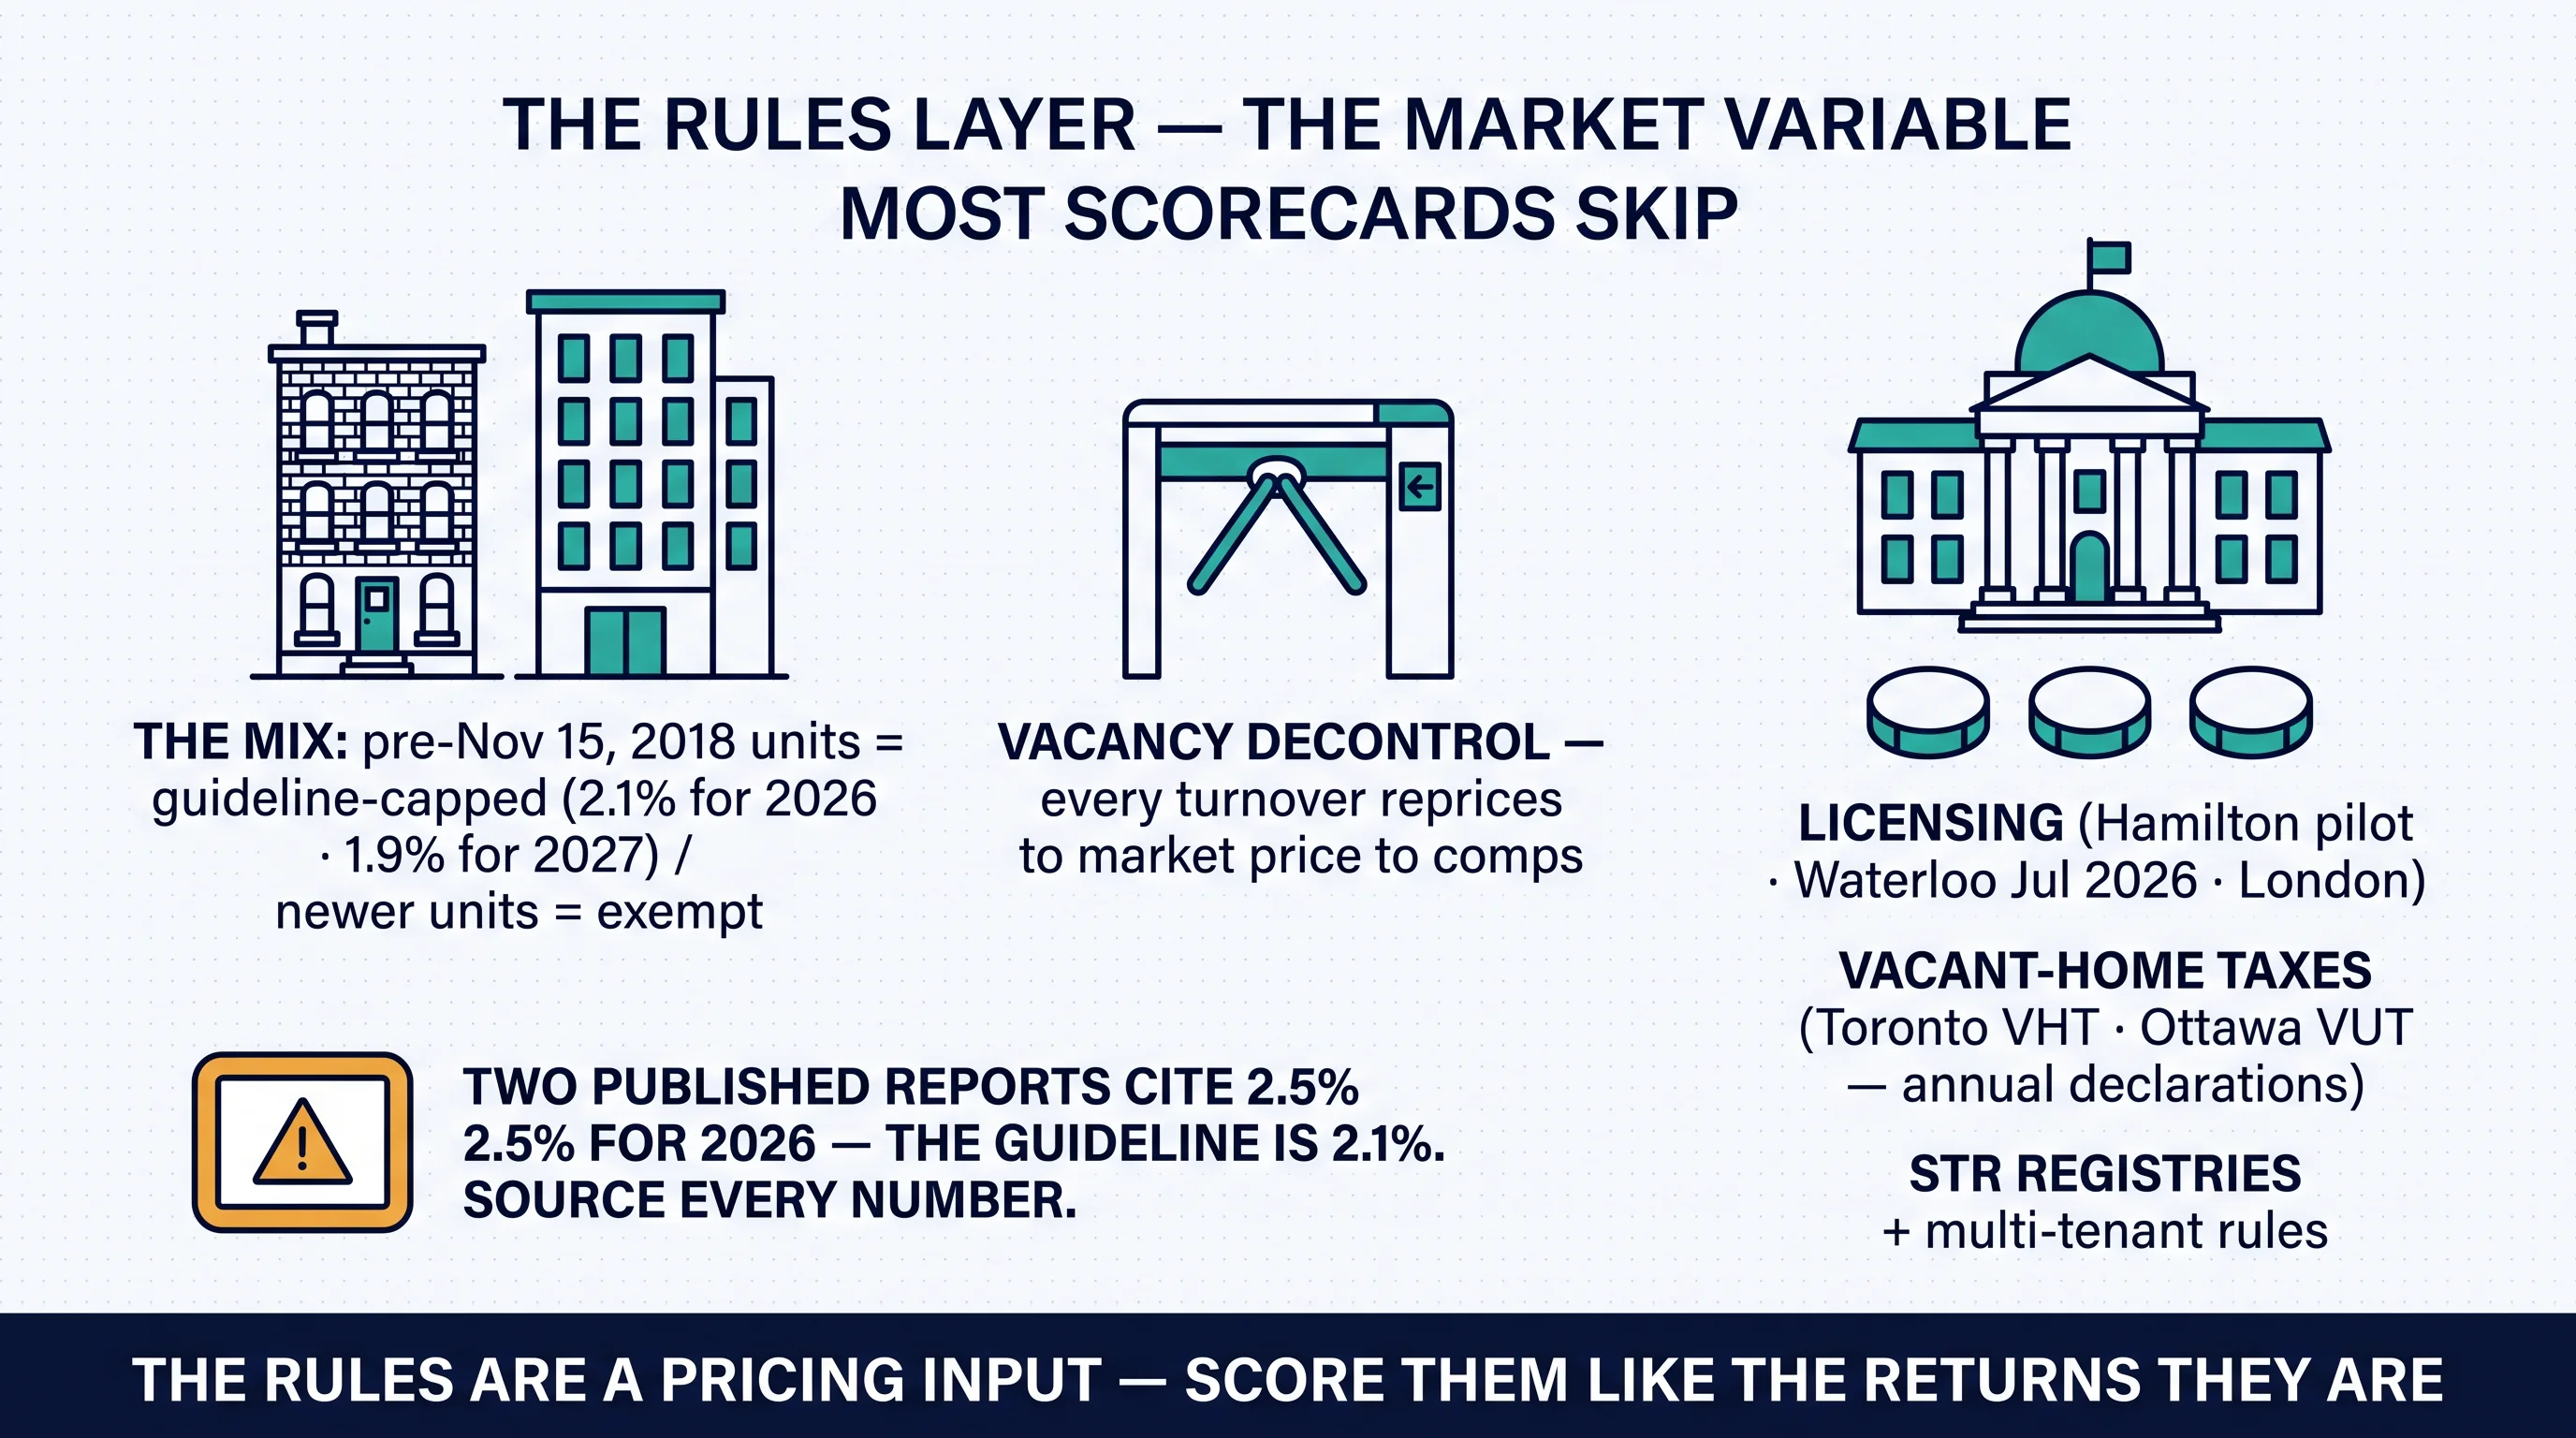
Every city above runs on the same Residential Tenancies Act — and the rules still change the math city by city, because what differs is the housing stock. Units first occupied before November 15, 2018 are bound by the annual rent-increase guideline — 2.1% for 2026 and 1.9% for 2027 — served on an N1 notice with 90 days' notice; units first occupied after that date are exempt and use the N2. Vacancy decontrol reprices any unit to market between tenancies — carefully, in a 3% market, where the comps are softer than the screenshots circulating from 2022. Older-stock cities like Hamilton, London, and Windsor carry more guideline-capped units, which makes retention economics and lawful turnover practice central to returns; heavy-new-supply markets carry more exempt stock but face softer market comps. The full mechanics live in our 2026 rent-increase guide and 2027 guide.
On top of the provincial layer sit the municipal overlays, and they belong on the scorecard as city-picking criteria, not fine print. Rental licensing regimes differ by city — Hamilton runs a pilot, Waterloo's updated bylaw takes effect July 2026, London has its own requirements — and our city-by-city licensing tracker ships this sprint to hold them all in one place. Toronto's Vacant Home Tax and Ottawa's Vacant Unit Tax both require annual declarations regardless of occupancy, with real dollars attached to missed filings. Toronto's multi-tenant housing framework licenses room-by-room rentals citywide, and short-term rental registries constrain the Airbnb-to-long-term arithmetic in every major market — the ground rules are in our short-term tenancies guide. And the compliance baseline is provincial: doubled fines, written duties, and the September 21, 2026 changes covered in our Bill 60 and Bill 97 guide. The scorecard includes a rules column because the rules are returns.
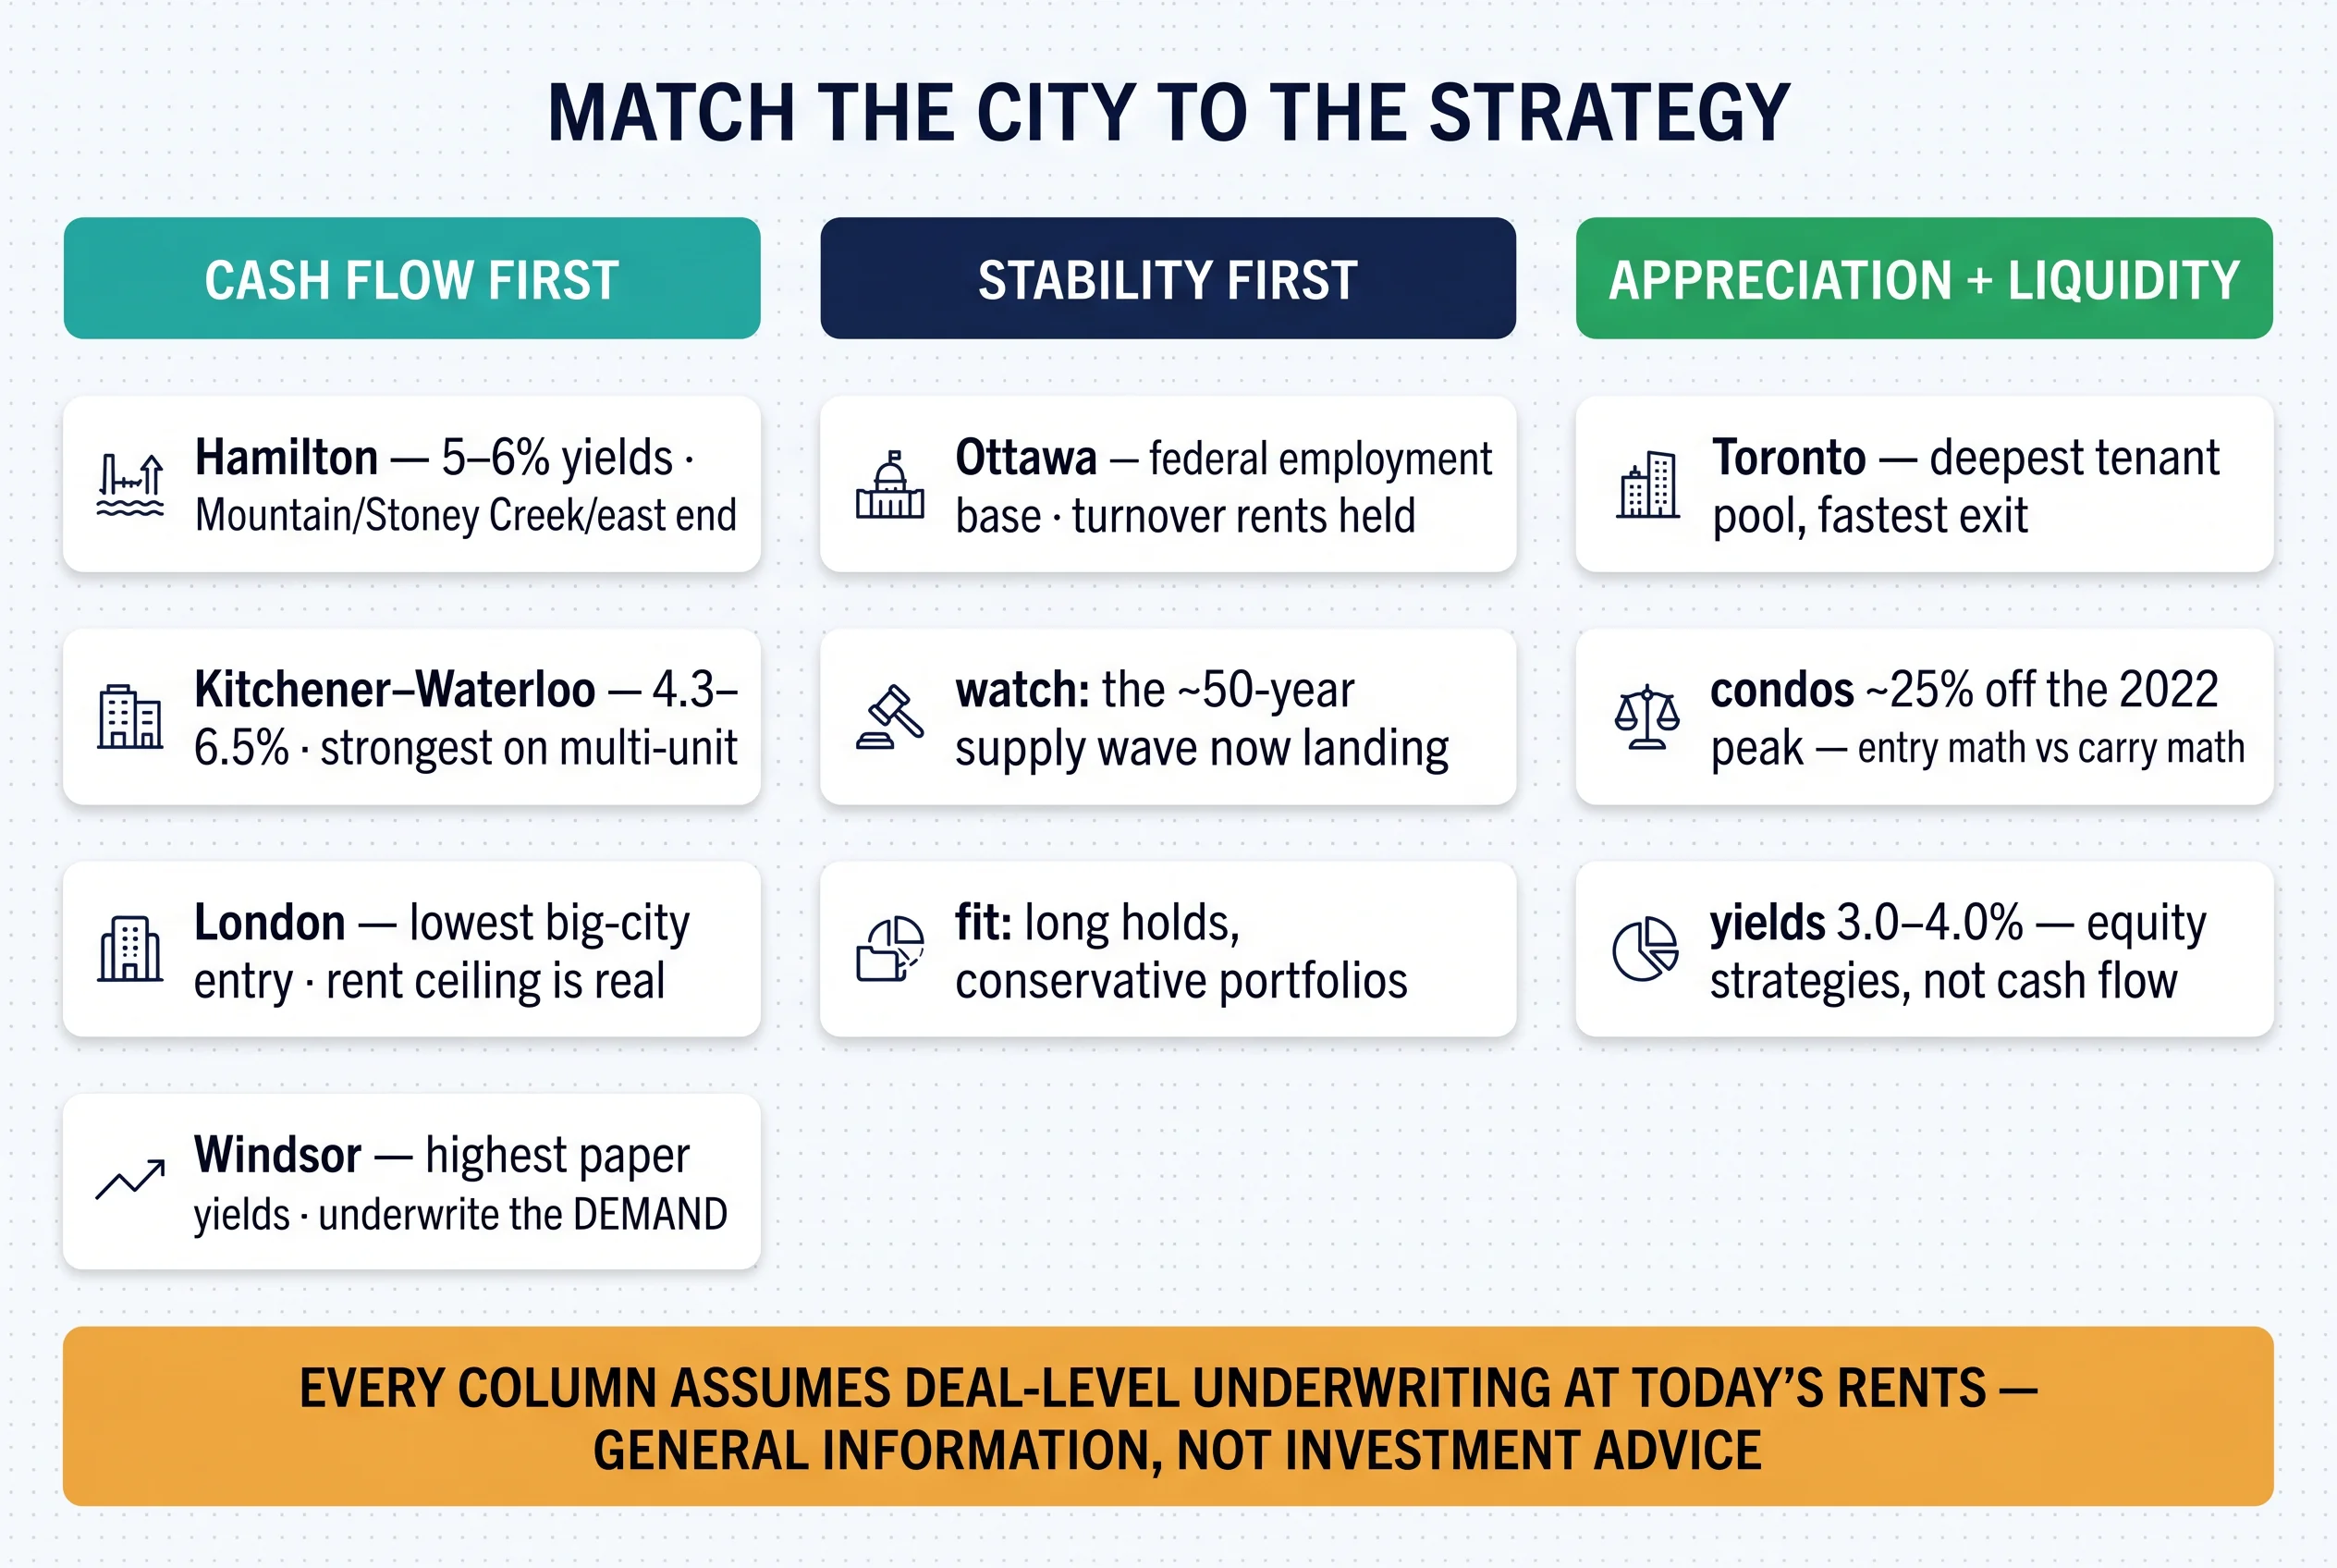
Match the layers to the strategy and the shortlist writes itself: cash flow points west and south, stability points to Ottawa, appreciation and liquidity point to Toronto — with every column assuming deal-level underwriting at today's rents.
The Window: Where This Market Goes Next
The forward view, dated rather than predicted, comes from CMHC's 2026 outlook (forecasts as of January 15, 2026): vacancy stays elevated through 2026 as the completion wave lands, then tightens as condominium starts collapse on weak pre-construction sales while rental starts merely hold at strong levels — the supply pipeline behind the deficit math. Ontario is leading a national sales rebound on volume while prices lag, which is what a bottoming process looks like from the inside. If pre-construction is your pipeline lane, the two-closings arithmetic in our pre-construction condo guide is required reading before any deposit moves.
How to position — considerations, not advice: underwrite at today's rents, never hoped-for growth; prize retention economics over repricing; treat the condo correction as an entry-math opportunity only where the carry works at current rents and 2.25%-era financing; watch the employment prints in tariff-exposed markets before buying their yields; and re-run the scorecard on every data release — CMHC each December, board stats monthly, tax rates each spring. The operator who buys the balance year with discipline is building on numbers the market can't argue with; the one who waits for the headline to turn will be bidding against everyone who read the same headline.
And whichever city wins, the numbers only survive contact with real tenancies if the operating layer exists: the collection system, the automation stack with its red lines, the software that files Ontario forms natively, and the insurance that matches how the property is actually used. The city picks the numbers. The systems keep them.
Practical Takeaways
- Pick the strategy before the city. Cash flow, stability, or appreciation decide the shortlist — headlines don't.
- Underwrite at today's rents, with the vintage named. CMHC October 2025 (published December 2025) is the current survey; anything undated is a rumour with formatting.
- Read submarkets, not city averages. The quartile and zone tables are where returns hide — in both directions.
- Score the rules layer alongside the yields. Controlled-vs-exempt mix, licensing, vacant-home taxes — the rules column is part of the returns column.
- Price taxes with the assessment caveat. Toronto's lowest rate on the highest assessments can cost what a 1.5% rate costs elsewhere — compute dollars, not rates.
- Stress the demand column. Who is the tenant, and is that population growing, capped, or leaving? Windsor's row is the cautionary tale.
- Re-run the scorecard on every release. And price to comps at acquisition and at every turnover — a balanced market punishes stale sheets.
Quick win this week: run one candidate city through the full 20-check scorecard using the companion data pages. Long-term: build the operating system before the doors — the scaling ladder is climbable exactly as far as the systems underneath it.
The Ontario City Scorecard: 20 Checks Before You Buy a Rental in Any Market
Run any Ontario city through the same underwriting discipline the pros use — vacancy, rents, yields, taxes, and the rules layer most scorecards skip — before a dollar moves.
Get Free PDF →The Scorecard Is the Strategy
There is no best Ontario city to buy a rental property — there's a best city for your strategy, proven with numbers that carry their dates. Toronto sells liquidity and appreciation at cash flow's expense; Ottawa sells stability into a supply wave; Hamilton and Kitchener-Waterloo sell the balance of yield and growth; London sells the lowest big-city entry with an honest ceiling; Windsor sells yields that only survive honest demand underwriting. Around all of it, 2026 offers something rare: corrected prices, balanced vacancy, cheap-money financing at 2.25%, and a structural deficit that hasn't gone anywhere.
The operators who win this window won't be the ones who picked the hottest market. They'll be the ones who underwrote deals the market couldn't argue with, scored the rules layer like the returns it is, and ran the numbers again every time the data refreshed. The scorecard is the strategy. General information, not investment advice — bring your broker, your accountant, and your own numbers, and make the decision theirs to check and yours to own.
Whichever City Wins Your Scorecard, Bring the Operating Layer With You
Tenon10 follows you to any Ontario market — the Standard Lease, every LTB form with guided wizards, the rent-increase and termination calculators, and collection rails that build the ledger from day one. Free to start.
Free • No signup required • Updated for the Bill 60 changes in force 21 Sep 2026
Related Resources
The companion data pages (this sprint): the cap rates and average rents data page this scorecard draws from, the rent benchmarks by bedroom count, and the full property-tax comparison — all refreshed quarterly. City-by-city licensing, short-term rental, and vacant-home-tax trackers follow later this week, along with the neighbourhood-level guides for Toronto, Ottawa, Hamilton, and the student markets.
Buying and scaling: Becoming a Landlord in Ontario for the decision itself · Buying Your First Rental Property for the three sets of numbers · Pre-Construction Condos as Rentals for the pipeline lane · How to Scale a Rental Portfolio for the ladder from first door to twenty.
The rules that change the math: Ontario Rental Law Changes 2026 · Rent Increases 2026 (N1 Guide) · Rent Increases 2027 · The Ontario Standard Lease · Short-Term Rentals and the RTA.
The operating layer: Rent Collection at Scale · Tenant Turnover: Reducing Vacancy Days · Automation for Rental Management · Property Management Software in Ontario · Landlord Insurance · CRA Audits of Rental Income.
Forms and tools: the Ontario LTB forms hub · Standard Lease · N1 and N2 rent-increase notices · the rent increase calculator and termination date calculator.
Frequently Asked Questions
Is it a good time to buy a rental property in Ontario?
2026 offers an unusual combination that favours disciplined buyers: prices have corrected meaningfully (Ontario's benchmark sat at $753,300 in June 2026, down 4.6% year-over-year, with condos down 8.5%), the Bank of Canada is holding at 2.25%, and vacancy has loosened into balanced territory (3–5% provincially, per CMHC) — which means more selection, more negotiating room, and honest rent comps. What it is NOT is a rent-growth year: turnover rents for two-bedrooms fell in most major centres, so any deal must work at today's rents rather than hoped-for increases. Underneath the soft year sits the structural story — Ontario is projected to need roughly 418,000 rental units by 2034 with only about 211,000 expected to be built. Whether it's a good time for YOU depends on the deal-level math: a property that cash-flows at current rents, financed within your stress-tested headroom, in a city whose tenant base is durable. That's a scorecard question, not a headline question — and it's general information, not investment advice.
Which Ontario city has the best cash flow for rental property?
The cash-flow map points west and south of Toronto. Hamilton and Kitchener-Cambridge-Waterloo post gross yields around 5–6% (KCW's range runs 4.3–6.5%, strongest on multi-unit properties), against 3.0–4.0% on downtown Toronto condos. London offers the lowest big-city entry point with two-bedroom purpose-built rents around $1,500 — about 27% below Toronto — though its median household income puts a ceiling on rent growth. Windsor shows the highest paper yields in the province, but 2026's reality check is real: vacancy above the provincial average, two straight years of declining student renters, temporary-foreign-worker permits not renewing, and tariff exposure on the manufacturing base — cheap is not the same as cash-flowing. Within every city, submarkets beat averages: Hamilton Mountain and Stoney Creek out-yield Ancaster; KCW's affordable quartile sits under 1% vacant despite the citywide multi-decade high. Run the specific deal, not the city's reputation.
Is Hamilton good for rental property investment?
Hamilton remains Ontario's classic investor market, and the 2026 numbers explain why: a benchmark price of $744,000 (May 2026) that appears to be finding its floor after two consecutive monthly gains, gross yields around 5–6%, a 3.6% vacancy rate, and durable demand from GTA migration, McMaster's roughly 36,000 students (about 60% renting off-campus), the hospital sector, and GO expansion. The defining feature is the two-market split: guideline-capped sitting tenancies on the older stock versus turnover and secondary-market units resetting to market rent — turnover rents ran up 12.9% year-over-year into early 2026 before cooling. Neighbourhood tiering matters — the Mountain, Stoney Creek, and the east end deliver the yields, while Ancaster, Dundas, and Westdale command 20–35% premiums. Two watch-items: CMHC expects vacancy to peak in 2026 on record completions (a window for patient buyers, slower rent growth for owners), and Hamilton runs a rental licensing pilot — check the current requirements before you buy.
What's the cheapest Ontario city to buy a rental — and should I?
Windsor holds the low end among major cities on both prices and rents (average rent $1,651), with Sudbury and Thunder Bay playing similar roles in the north — and the honest answer to "should I?" is: only with the demand column underwritten as hard as the price column. Windsor's 2026 picture pairs bargain entry with a 3.7% vacancy rate (above the provincial average), two consecutive years of falling international-student renters, temporary-foreign-worker permits lapsing, tariff and trade exposure on its manufacturing employment base, and CMHC intelligence noting laid-off workers relocating to Alberta. It also carries the province's highest property-tax rates — the mirror image of Toronto's lowest-rate-highest-assessment structure. None of that makes a specific Windsor deal wrong; it makes the effortless-demand assumption wrong. If the pro forma survives a realistic vacancy allowance, conservative rents, and full carrying costs, cheap markets can work — but the spreadsheet yield is the beginning of the underwriting, not the end.
How does rent control affect which city I should buy in?
Ontario's rent rules are provincial, but their impact varies by city because the housing STOCK varies. Units first occupied before November 15, 2018 are bound by the annual guideline — 2.1% for 2026 and 1.9% for 2027 (two published market reports currently cite 2.5%; that figure is wrong) — while newer units are exempt, and vacancy decontrol lets any unit reprice to market between tenancies. Older-stock cities like Hamilton, London, and Windsor therefore carry more guideline-capped units, which makes retention economics and lawful turnover practice central to returns; cities with heavy new supply carry more exempt stock but softer market comps. On top sit the municipal overlays that belong on any scorecard: rental licensing regimes (Hamilton's pilot, Waterloo's July 2026 update, London), Toronto's Vacant Home Tax and Ottawa's Vacant Unit Tax declaration requirements, Toronto's multi-tenant housing framework, and short-term rental registries. The rules layer isn't fine print — it's a pricing input, and it differs street by street.
This article provides general information about Ontario rental markets as of July 12, 2026 and is not investment, legal, financial, or tax advice. Market data changes continuously — figures are as of the dates shown and should be verified at source (CMHC, OREA/CREA, municipal websites) before any decision. Consult a licensed real estate professional, mortgage broker, lawyer, and accountant about your specific situation before purchasing, financing, or leasing a rental property.


