

Ask what the cap rate is in Ontario and you'll get a confident number every time — a different one from every person. Here's the honest answer: there is no Ontario cap rate. There are bands, by asset class and submarket, each with a date on it. CBRE prints Toronto multifamily High Rise A at 4.25–4.75% (Q4 2025); brokers underwrite Hamilton small-scale deals anywhere from 4.5% to 7%; and behind every one of those numbers sit two different rent series measuring two different things.
The problem is that cap-rate content comes in three flavours — institutional PDFs priced for pension funds, mortgage-broker blogs built to sell financing, and definition explainers that never touch a real market — while rent data is scattered across surveys that don't measure the same thing. Nobody maintains the landlord-grade table. So people make six-figure decisions on numbers they can't source. This page is the fix: cap-rate bands and both rent series for every major Ontario city, methodology shown, every figure dated, refreshed quarterly — plus the literacy layer that makes the table usable: what a cap rate is, what it can't say, and why the two rent series converging from above changes what "market rent" means in every 2026 pro forma. It feeds the best-cities scorecard and stands alone as the reference. General information, not investment advice — and built to be cited.
The Ontario Cap Rate & Rent Data Table: Every City, Every Figure Dated (XLSX)
The reference table as a working spreadsheet — cap-rate bands and both rent series for every major Ontario city, plus a formula-live cap-rate calculator that runs your deal the way a lender would.
Get Free PDF →What a Cap Rate Is — and the Two Errors That Break It
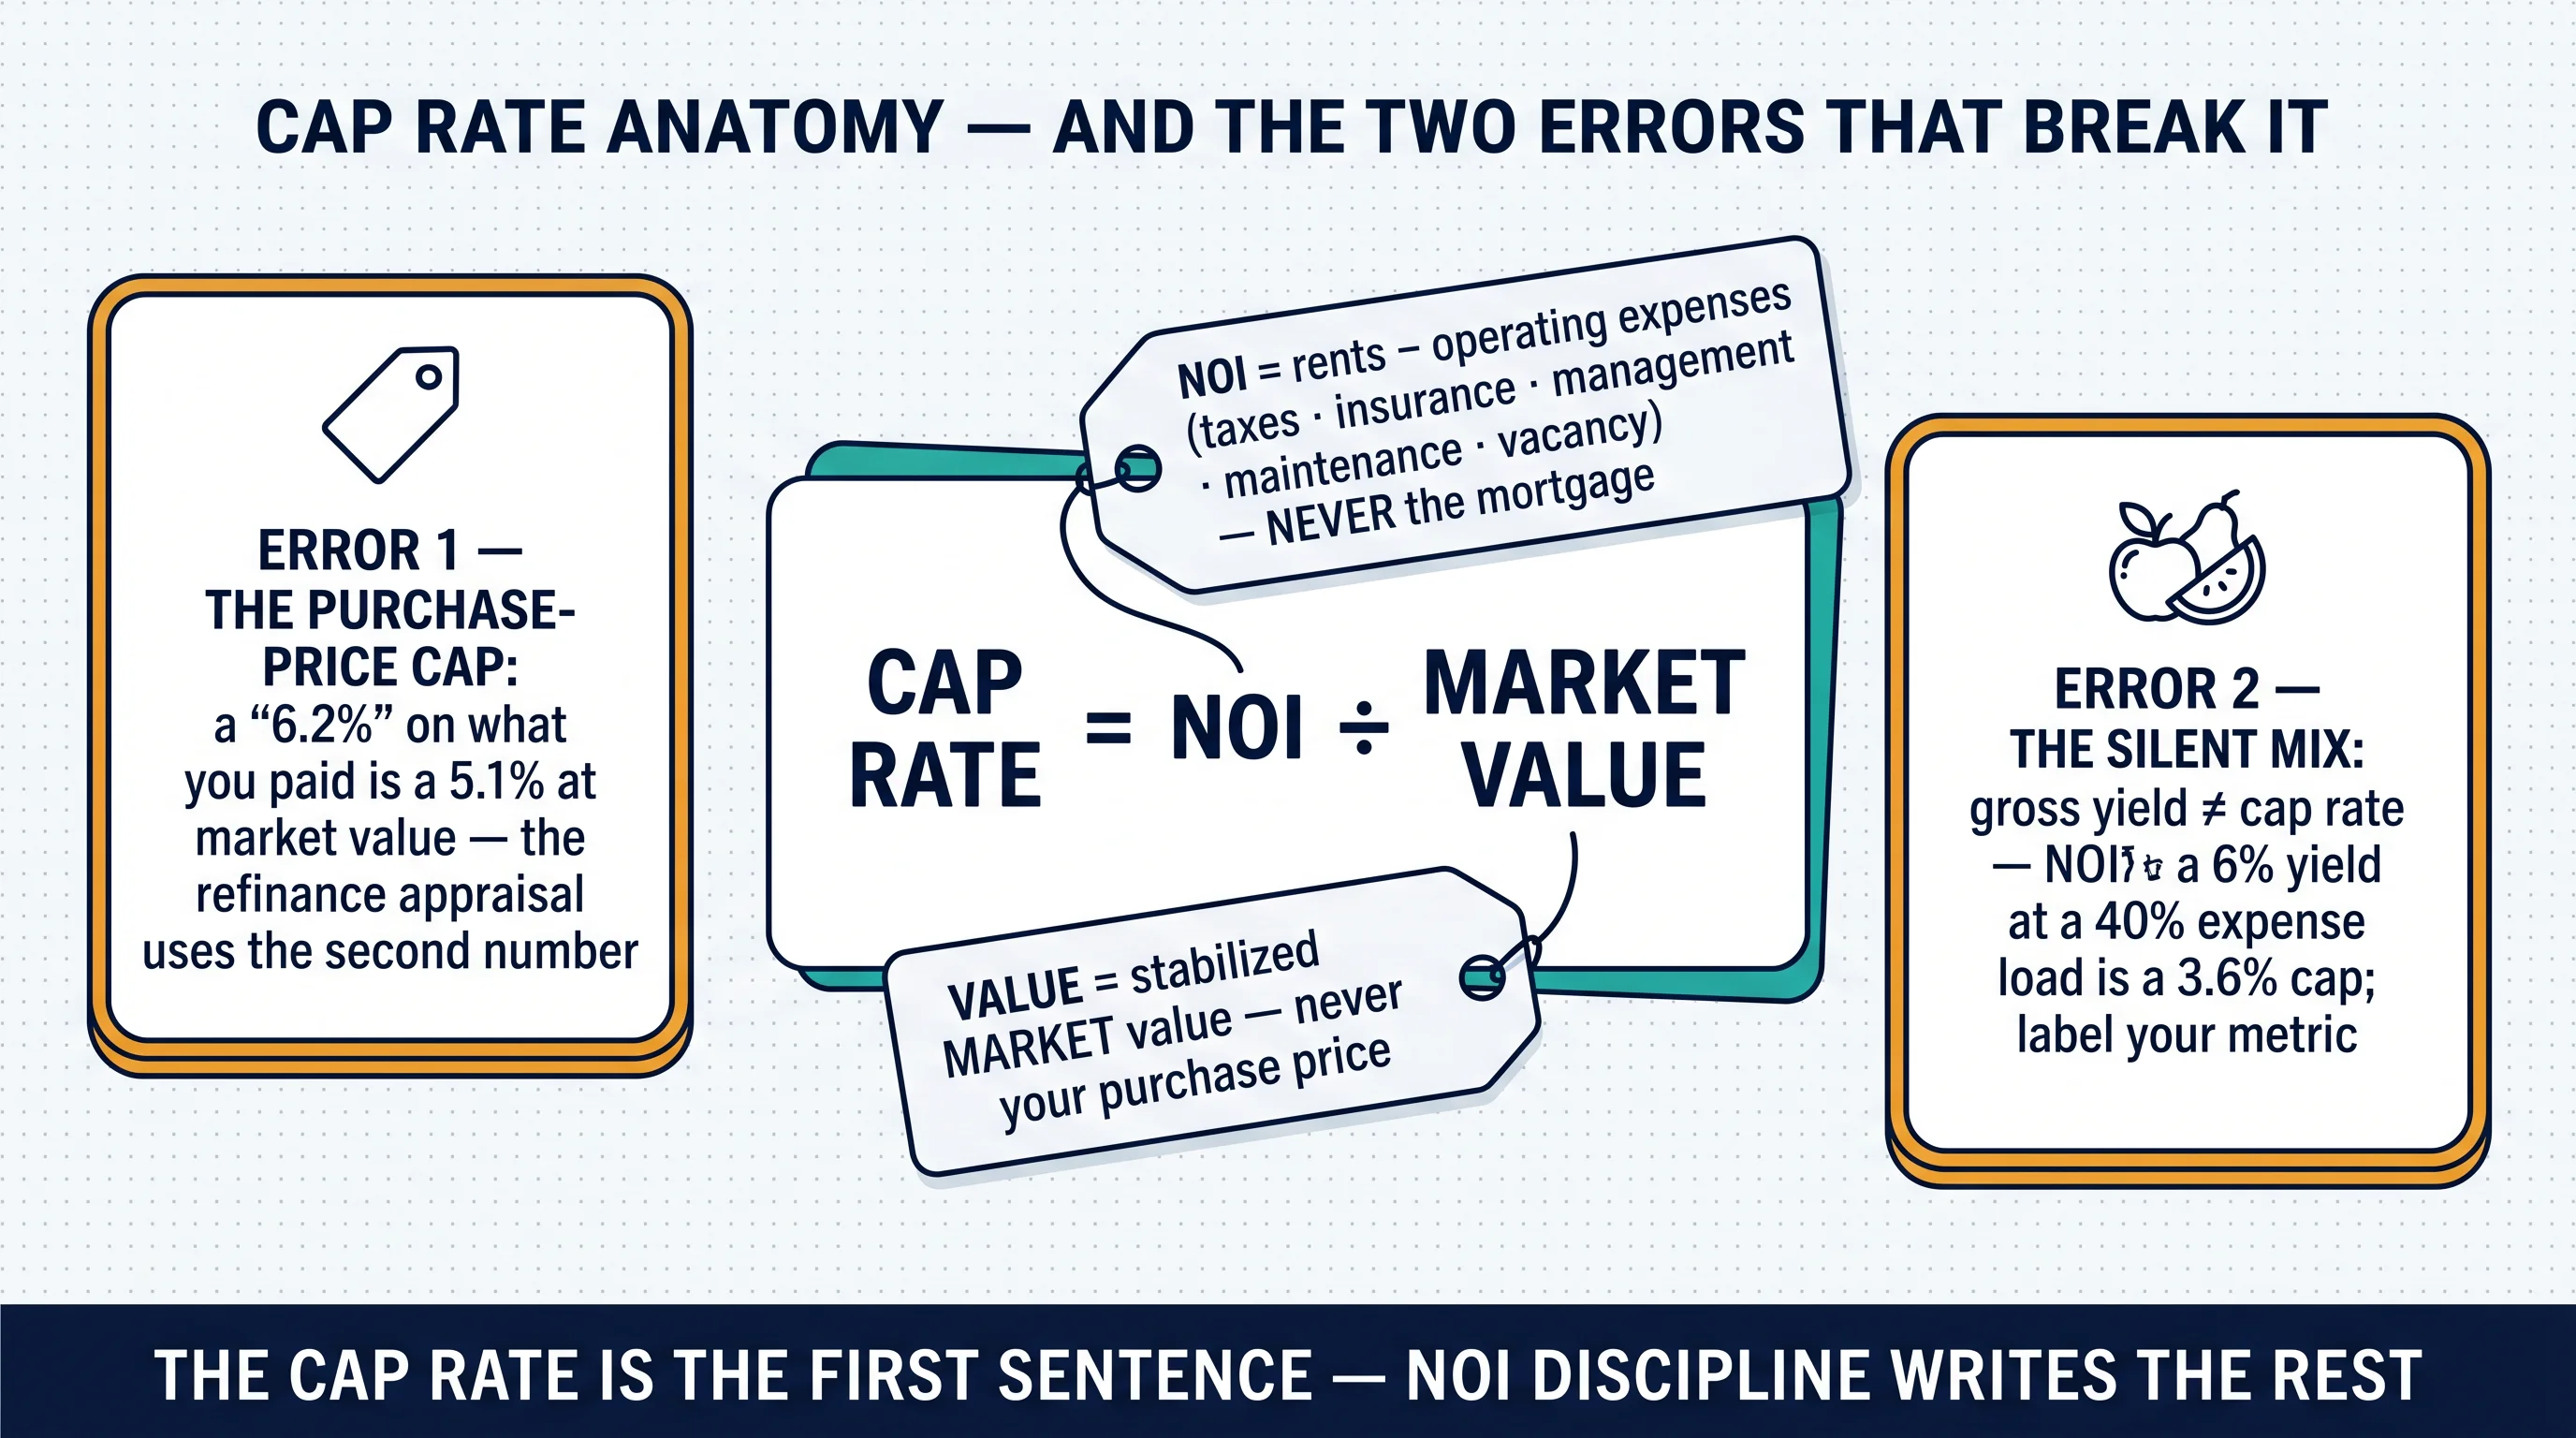
The definition, properly: cap rate = net operating income ÷ value. NOI is annual rental income minus operating expenses — property taxes, insurance, management, maintenance, utilities you pay, and a realistic vacancy allowance — computed before financing; the mortgage never enters a cap rate. And "value" means stabilized market value: what the property is worth today, appraised honestly. Both halves have rules, and both halves get broken constantly in the same two ways.
Error one: the purchase-price cap rate. A buyer negotiates below ask, computes NOI over what they paid, and announces a "6.2% cap." At stabilized market value it's 5.1% — a fine deal, but a different one, and the difference isn't cosmetic: the refinance appraisal will use the second number, and every projection built on the first one inherits the flattery. If your cap rate improves every time you negotiate well, you're not measuring the property — you're measuring your ego.
Error two: the silent yield/cap mix. Gross yield — annual rent divided by price, the quick band our city scorecard uses for fast comparison — ignores operating expenses entirely. A cap rate nets them out. A 6% gross yield carrying a 40% expense load is a 3.6% cap rate. Most published comparison tables mix the two without labels: Hamilton's "5–6%" (gross yield on small residential) sits beside CBRE's 4.4% (true cap on institutional high-rise), a reader concludes Hamilton crushes Toronto, and a decision gets made on fruit salad. Label your metric, every time, or the comparison is noise.
What keeps the number honest is NOI discipline of the kind CMHC applies when it underwrites multifamily: rents verified against actual leases, occupancy, and market comparison; expenses benchmarked against comparable buildings rather than taken from the seller's pro forma; vacancy assumed realistically for the submarket. And know what the finished number still can't tell you: appreciation prospects, financing structure, capital-expenditure needs, the rent-control mix of the stock, demand durability. A cap rate is the first sentence of an analysis, not the whole story — pair it with cash-on-cash return and the lender's DSCR lens (1.25+ is the standard floor, and the full financing ladder lives in our portfolio-scaling guide) before it becomes a decision. If you're buying your first property, the three-sets-of-numbers discipline in our first-rental guide is the companion read.
The Table: Cap-Rate Bands and Rents by City
How to read it: bands, not points — and every cell carries its date. Institutional prints (CBRE, Q4 2025 with Q1 2026 direction) sit beside broker underwriting bands (July 2026), CMHC occupied-stock rents (October 2025 survey, published December 2025), and current asking markers (June–July 2026). Where a verified figure doesn't exist, the cell says "see CMHC table" — this page does not invent numbers.
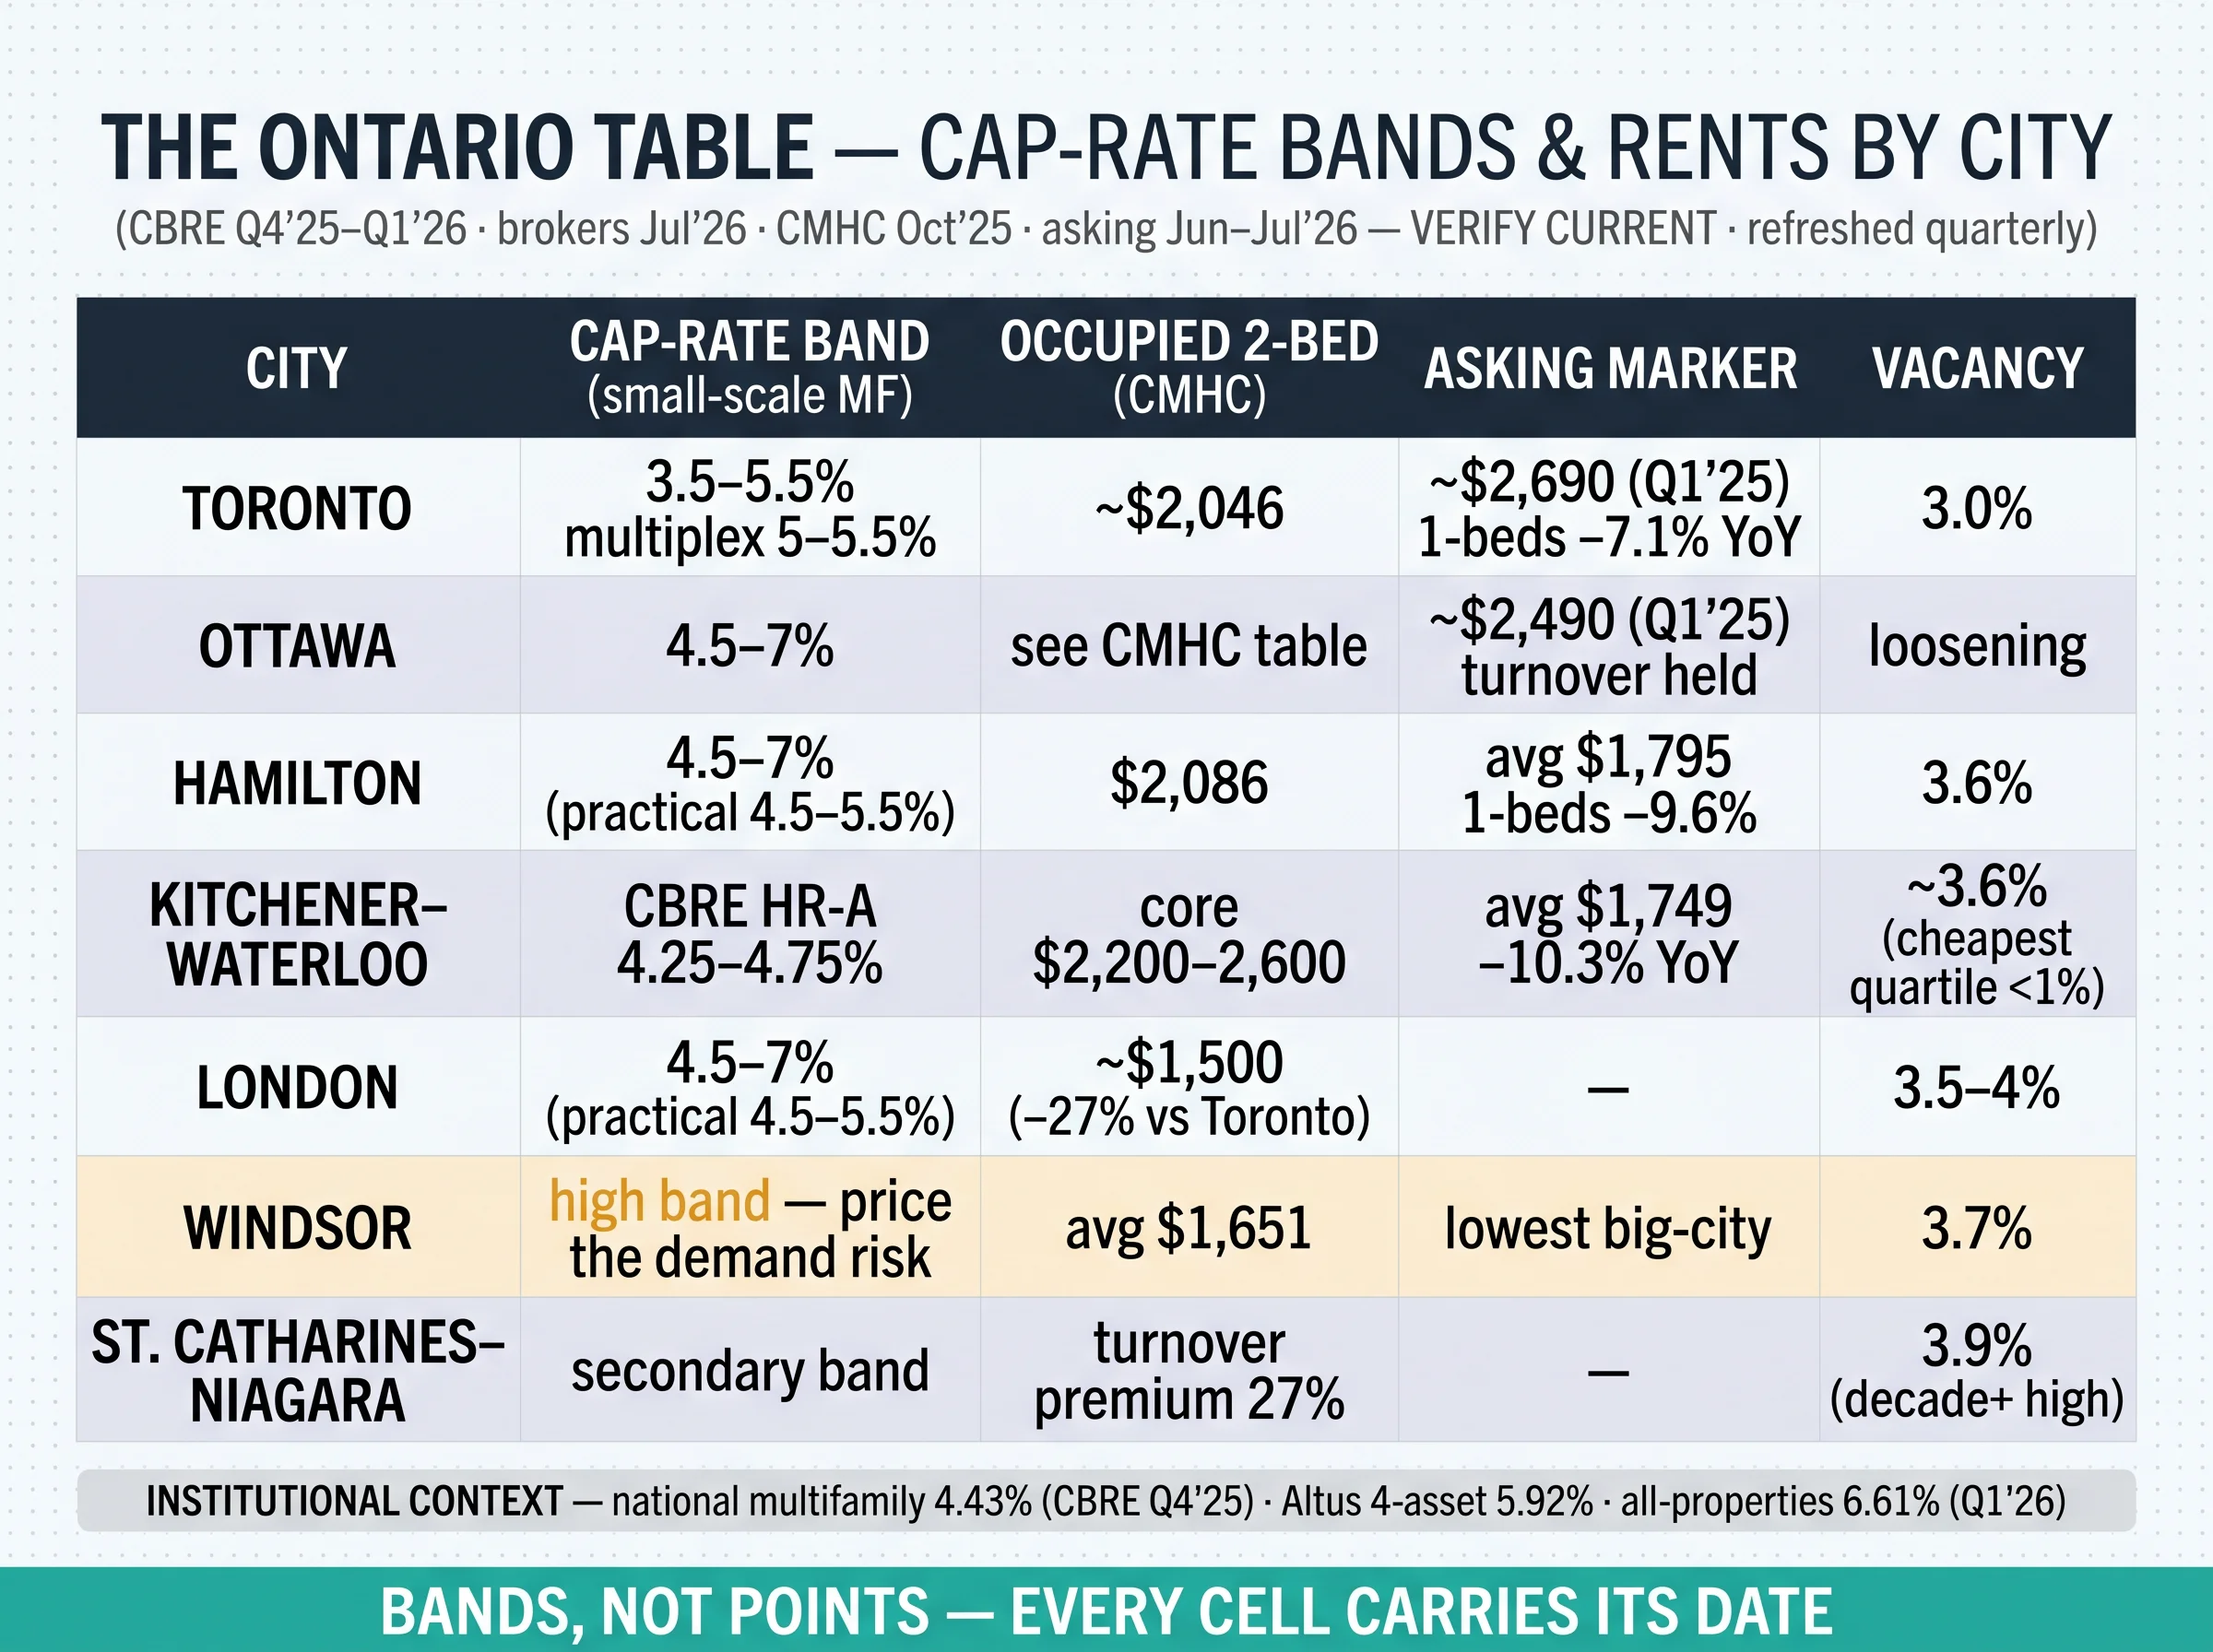
Toronto runs a broker band of 3.5–5.5%, with small multiplexes at 5–5.5% widely described as the strongest income-stability balance of the moment and condos holding the lowest cap rates in the city — and the greatest likelihood of negative cash flow at current prices. Occupied two-beds average ~$2,046 while asking sat near $2,690 (Q1 2025) and is falling 7.1% year-over-year on one-beds; vacancy 3.0%. Ottawa trades in the secondary band (4.5–7%) with two-bed asking around $2,490 and a distinction no other market earned: turnover rents held while peers fell — into the largest new-supply wave in roughly 50 years. Hamilton shares the 4.5–7% band (practical deals clustering 4.5–5.5%), with occupied two-beds at $2,086 against an asking average of $1,795 — its one-bed asking correction of −9.6% is Ontario's steepest — and vacancy at 3.6%. Kitchener–Cambridge–Waterloo is the quiet surprise: CBRE prints its High Rise A at 4.25–4.75%, exactly as compressed as Toronto's, while Kitchener asking rents fell 10.3% year-over-year to $1,749 — and the cheapest rent quartile sits under 1% vacant against the citywide multi-decade high. London mirrors Hamilton's band with occupied two-beds around $1,500, 27% under Toronto. Windsor prints a high band that comes with a demand-risk discount nobody publishes — average rent $1,651, vacancy 3.7%, and the tenant-base questions our city scorecard walks through. St. Catharines–Niagara contributes the table's most quotable datum: vacancy at a decade-plus high of 3.9%, and a 27% premium of turnover rents over sitting rents — vacancy decontrol quantified in one number. Smaller markets (Kingston, Oshawa, Sudbury, Thunder Bay) price higher with risk on thin prints — directional only; pull CMHC's per-centre tables.
The institutional context, for when someone quotes "the cap rate" at you: the national multifamily average was 4.43% (CBRE, Q4 2025), with Q1 2026 showing multifamily yields inching higher while industrial and office compressed; Altus's four-asset benchmark printed 5.92% and its all-properties average 6.61% (Q1 2026). Those are real numbers about different assets — institutional towers and blended portfolios, not your fourplex — and misquoting them as residential comps is how confident errors start. When your own NOI needs proving — at refinance, at sale, at audit — the records discipline in our CRA rental-income guide is what makes the number defensible.
The Two Rent Series — and Why They're Converging
Every rent figure you've ever quoted belongs to one of two series, and they are not interchangeable. Series A — CMHC's occupied-stock averages (October 2025 survey, published December 2025; next December 2026): what sitting tenants actually pay across the purpose-built universe, long leases and rent-controlled units included. It runs lower and moves slowly — the deep, honest baseline. Series B — asking rents: what vacant units are listed for today, tracked by StatCan and CMHC's quarterly program and by platform reports monthly. It runs higher and moves fast — the noisy, current signal.
The gap, quantified in one city: Toronto's occupied two-bed average is about $2,046; its two-bed asking rent printed around $2,690 (Q1 2025). Both numbers are true. They measure different things. And 2026's defining move is that they're converging from above: asking rents falling toward occupied averages — Hamilton one-beds −9.6%, Kitchener −7.7%, Toronto −7.1% year-over-year, with the national asking average around $2,012 in July after three monthly upticks off March's 35-month low — while CMHC's own mid-year analysis found that rent-controlled units in Toronto and Ottawa, when they turn over, reprice to match exempt new stock. The two truths are meeting in the middle, and the meeting point is the honest "market rent."

What it means in a pro forma: underwrite revenue off Series B with a haircut — today's asking comps, trimmed 3–5% in a falling-asking market, with incentives netted out (free months are everywhere this leasing season) — and budget growth off Series A's rules: on units first occupied before November 15, 2018, the guideline caps increases at 2.1% for 2026 and 1.9% for 2027 (served on an N1; exempt units use the N2), with full market repricing only at turnover — the mechanics live in our 2026 rent-increase guide and 2027 guide, and the pricing-the-turn discipline in our turnover system. The investor who underwrites the $2,690 asking print and budgets guideline growth on top is double-counting an era that's ending; the KCW landlord panicking at "−7.7%" headlines while their affordable-quartile building sits under 1% vacant with a waiting list is reading someone else's submarket. The mix, not the rule, sets the growth path.
Check your increase math: whatever the series say, the increase you can lawfully serve on a controlled unit is set by the guideline and the 12-month rule. Run your unit through the rent increase calculator before any N1 goes out.
Reading the Bands in 2026: Leverage, Direction, and the Refresh Contract
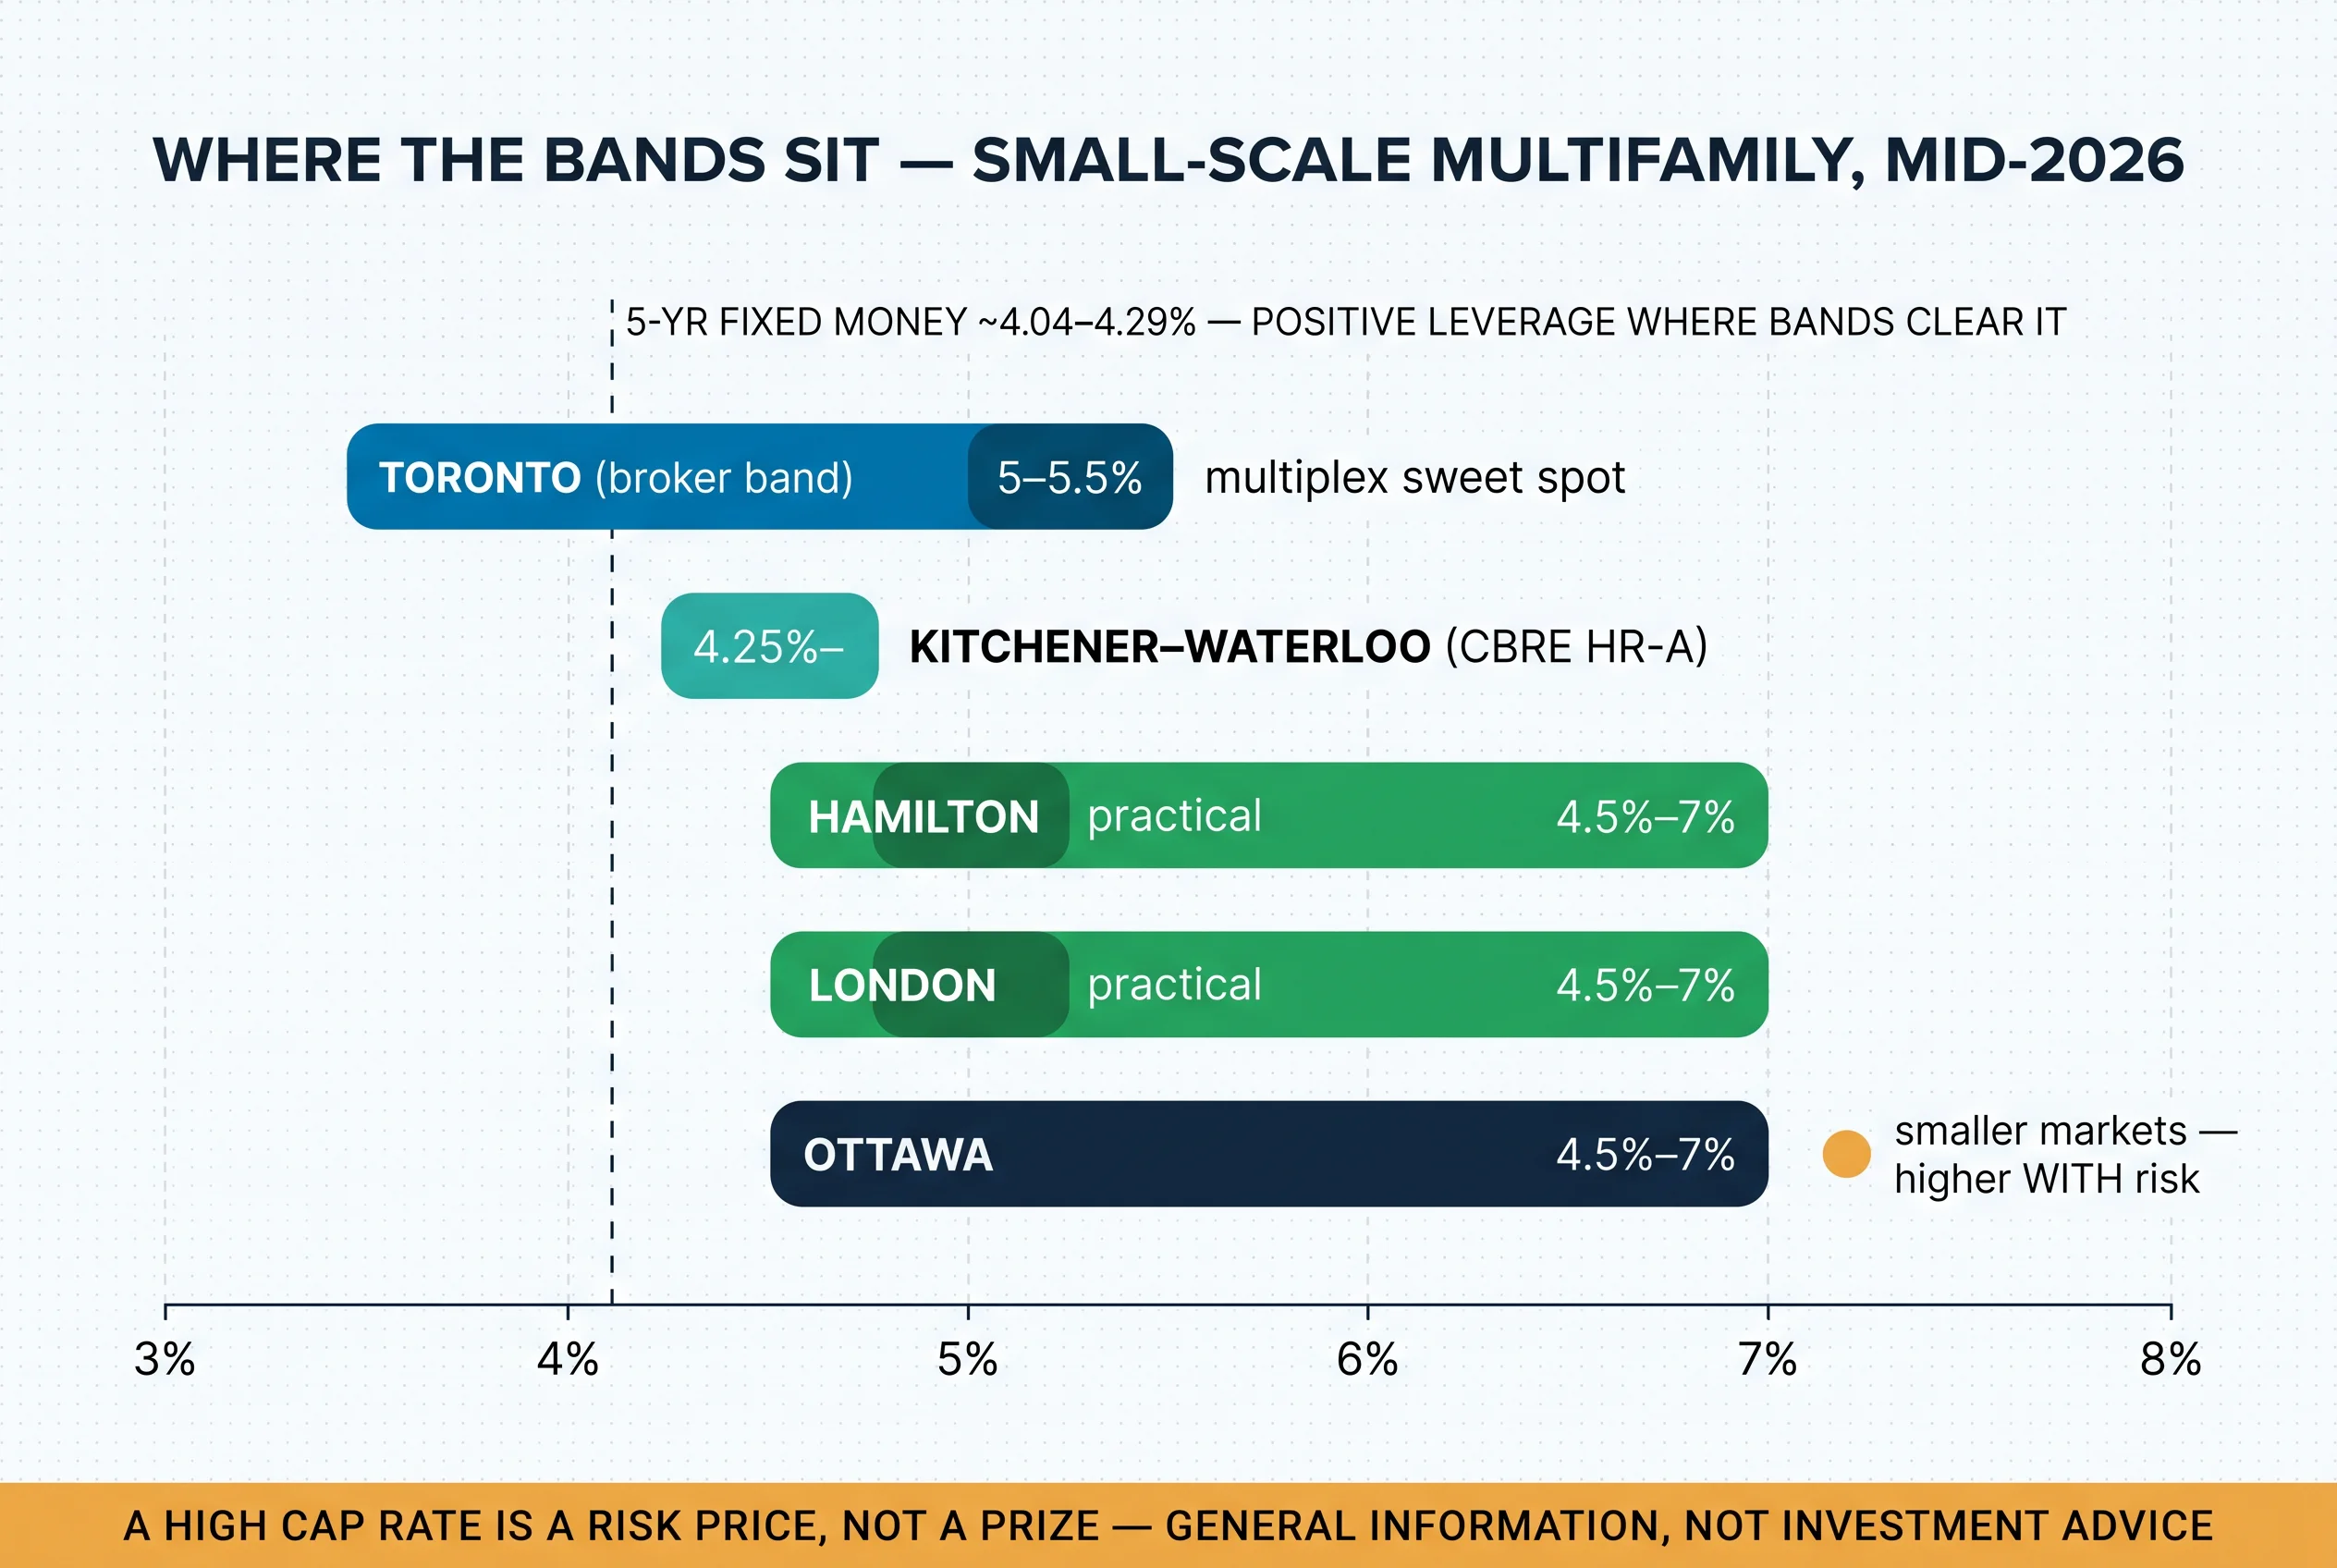
Positive leverage is back. With the Bank of Canada at 2.25% and five-year fixed money around 4.04–4.29%, prime multifamily cap rates clear the cost of debt for the first time in this cycle — the spread that makes leveraged real estate work exists again. The discipline warning writes itself: spreads returning is exactly when underwriting standards erode, because deals that "work" start appearing everywhere. The band chart below shows where each market clears the money line — and where it doesn't.
Direction, dated rather than predicted: stabilization, not uniform movement. Multifamily drifted slightly wider nationally through Q1 2026 with selective compression resuming in prime assets, and the 3.1% national purpose-built vacancy (up from 2.2%) is the soft-demand backdrop institutions are pricing. Nobody is calling a boom; everybody is pricing balance.
The refresh contract, printed: this page refreshes quarterly — next in October 2026, then December 2026 after the new CMHC Rental Market Survey publishes. Every figure above carries its vintage, and the table says "verify current" on its own face. Between refreshes, the sources are named — CBRE's quarterly cap-rate report, CMHC's survey tables, the StatCan asking-rent program, the monthly platform prints — pull them yourself for any live deal, and keep the resulting NOI provable in records built for the purpose: the payment ledger, the software that keeps it, and the insurance line people forget to benchmark.
Practical Takeaways
- Never quote a cap rate without its date, asset class, and submarket. Bands, not points — and "the Ontario cap rate" doesn't exist.
- Compute NOI like a lender: verified rents, benchmarked expenses, realistic vacancy — and value at stabilized market, never your purchase price.
- Label gross yield vs cap rate in every sheet you build or read; a 40% expense load turns 6% into 3.6%.
- Underwrite revenue off asking rents with a haircut and incentives netted; budget growth off the rules — 2.1%/1.9% on controlled stock, market repricing at turnover.
- Cross-check every cap with cash-on-cash and DSCR 1.25+ before believing it.
- Price the rules layer into NOI — taxes, licensing, vacancy allowance — before comparing across city lines.
- Re-pull the sources quarterly, and re-run any live deal the day a new print lands.
Quick win tonight: download the data table and run one real listing through the calculator sheet — the yellow cells are yours, the formulas do the rest, and the pre-loaded example shows exactly how a 6.7% gross yield becomes a 3.67% cap and a 0.80 DSCR. Long-term: keep a dated comp file per target market. The operator with a sourced number beats the operator with a confident one, every quarter, forever.
The Ontario Cap Rate & Rent Data Table: Every City, Every Figure Dated (XLSX)
The reference table as a working spreadsheet — cap-rate bands and both rent series for every major Ontario city, plus a formula-live cap-rate calculator that runs your deal the way a lender would.
Get Free PDF →Cite the Band, Date the Number, Underwrite the Deal
There is no Ontario cap rate — there are dated bands, from Toronto's compressed 4s to the 6-plus territory of smaller markets; two rent series measuring different truths; and a 2026 that's converging them from above. A cap rate is the first sentence of an analysis: NOI discipline writes the rest, the rules layer prices into every line, and the refresh cadence is what keeps any of it true. This page exists to be cited — bands with vintages, sources with names, a table that tells you when it was last checked and when it will be checked next. Use it as the comparison language. Then underwrite the specific deal like the language never existed. General information, not investment advice — the professionals check the math, and you own the decision.
The Numbers Live or Die in the Records
Tenon10 keeps your NOI provable from the first lease — the Standard Lease, every Ontario form with guided wizards, the calculators, and collection rails that build the ledger automatically. Free to start.
Free • No signup required • Updated for the Bill 60 changes in force 21 Sep 2026
Related Resources
The Cities cluster: the Best Ontario Cities to Buy a Rental Property scorecard this table feeds · the rent-benchmarks-by-bedroom page and the full property-tax comparison (this sprint — the quarterly data siblings) · the city-by-city licensing, short-term-rental, and vacant-home-tax trackers following this week.
Buying and scaling: Becoming a Landlord in Ontario · Buying Your First Rental Property (the three sets of numbers) · How to Scale a Rental Portfolio (DSCR, MLI Select, and the financing wall) · Pre-Construction Condos as Rentals.
The rules in the NOI: Rent Increases 2026 (N1 Guide) · Rent Increases 2027 · Ontario Rental Law Changes 2026 · The Ontario Standard Lease.
The operating layer that proves the income: Rent Collection at Scale · Tenant Turnover: Reducing Vacancy Days · CRA Audits of Rental Income · Property Management Software in Ontario · Landlord Insurance.
Forms and tools: the Ontario LTB forms hub · Standard Lease · N1 and N2 · the rent increase calculator and termination date calculator.
Frequently Asked Questions
What is a good cap rate in Ontario in 2026?
There isn't one number — there are bands by market and asset type, each with a date attached. As of mid-2026: institutional multifamily prints around 4.43% nationally (CBRE, Q4 2025), with Toronto and Kitchener–Waterloo High Rise A both at 4.25–4.75%; broker underwriting bands for small-scale multifamily run roughly 3.5–5.5% in the GTA and 4.5–7% in Ottawa, Hamilton, and London, with smaller markets higher; Toronto small multiplexes around 5–5.5% are widely described as the strongest income-stability balance of the moment, while condos carry the lowest cap rates in every city and are the most likely to be cash-flow-negative at current prices. "Good" depends on the seat: buyers want higher (less price per dollar of income), sellers want lower, and a high cap rate is a risk price, not a prize — Windsor's high band and Toronto's low band are both correctly priced markets answering different questions. Judge any specific number against its band, its vintage, and the NOI discipline behind it.
How do I calculate a cap rate correctly?
Cap rate = net operating income ÷ value, and both halves have rules. NOI is annual rental income minus operating expenses — property taxes, insurance, management, maintenance, utilities you pay, and a realistic vacancy allowance — but NOT mortgage payments; financing never enters a cap rate. Use verified rents (actual leases and occupancy, checked against market), and benchmark expenses against comparable buildings rather than trusting a seller's pro forma. Value means stabilized market value — what the property is worth today — not your purchase price: computing on a below-ask price flatters the number and fails at the refinance appraisal, which will use market value. And keep it distinct from gross yield (annual rent ÷ price), which ignores expenses entirely — a 6% gross yield at a 40% expense load is a 3.6% cap rate. The cap rate you calculate this way is a comparison tool; pair it with cash-on-cash return and the DSCR test (lenders want 1.25+) before it becomes a decision.
What's the difference between asking rent and average rent?
They're different instruments measuring different things, and confusing them breaks pro formas. CMHC's average rents (from its October survey, published each December) measure what sitting tenants actually pay across the purpose-built stock — long leases and rent-controlled units included, so the number runs lower and moves slowly: Toronto's occupied two-bedroom average is about $2,046. Asking rents measure what vacant units are listed for TODAY — StatCan and CMHC's quarterly program put Toronto's two-bedroom asking rent around $2,690 (Q1 2025), with platform data showing those asking prices falling 7–10% year-over-year across Ontario cities through mid-2026. In 2026 the two series are converging from above: asking rents are falling toward occupied averages, and CMHC's own analysis shows rent-controlled units repricing to match exempt stock when they turn over. For underwriting: project revenue from current asking rents with a haircut (and net out incentives like free months), and budget rent growth from the rules that govern your stock — the 2.1% guideline for 2026 on controlled units, market repricing only at turnover.
Are rents going down in Ontario in 2026?
Asking rents — the price of a vacant unit today — have been falling across most Ontario cities: one-bedroom asking rents dropped 9.6% year-over-year in Hamilton, 7.7% in Kitchener, and 7.1% in Toronto (June 2026 platform data), with the national average asking rent around $2,012 in July 2026, though that national figure has now ticked up for three consecutive months off a 35-month low in March. Occupied-stock averages — what sitting tenants pay — are still edging upward, because turnover repricing and guideline increases move that slower series in the other direction. So both headlines you've seen ("rents falling" and "rents rising") are true; they're describing different series. The drivers of the asking-rent correction: a purpose-built supply wave, population growth slowing to 0.9% on reduced temporary-resident inflows, and a soft leasing season with landlord incentives common. For a landlord, the practical read is to price vacant units to live comps rather than last year's screenshots, protect occupied weeks, and treat retention as the higher-value play in a balanced market.
Why do cap rates differ so much between Ontario cities?
Because a cap rate is a risk price, and the risks differ. Toronto's compressed rates (institutional High Rise A at 4.25–4.75%) reflect buyer confidence: the deepest tenant pool, the fastest re-leasing, the best exit liquidity, and hard supply constraints — investors accept a lower initial yield for durable income and appreciation optionality. Secondary markets like Hamilton, London, and Ottawa trade at 4.5–7% because buyers demand more return for thinner liquidity and less certain growth; smaller markets price higher still. The rules-and-costs layer widens the spread further: property-tax burdens (Windsor's highest-in-province rates versus Toronto's lowest rate on highest assessments), municipal licensing overhead, the controlled-versus-exempt stock mix that sets NOI growth paths, and the vacancy allowance an honest underwriter applies where demand durability is in question. Same building, different city line, different cap rate — correctly. The comparison isn't "which number is bigger"; it's whether the specific deal's NOI, financing, and risk story justify where it sits in its own market's band.
This data page provides general information about Ontario rental markets as of July 12, 2026 and is not investment, legal, financial, or tax advice. Cap rates, rents, and financing figures are as of the dates shown, are attributed to their sources (CBRE, Altus Group, CMHC, Statistics Canada, and named platform reports), and change continuously — this page refreshes quarterly, and all figures should be verified at source before any decision. Consult a licensed real estate professional, mortgage broker, appraiser, lawyer, and accountant about your specific situation before purchasing, financing, or leasing a rental property.


