

A Thunder Bay house can cost less than the down payment on a Toronto condo. Sudbury and Windsor rents rival cities that cost twice as much to buy into. And local investors quote cap rates the GTA hasn't seen in a decade. On paper, Ontario's cheap cities look like a cash-flow dream. But "cheap" and "cash-flows" are not the same word.
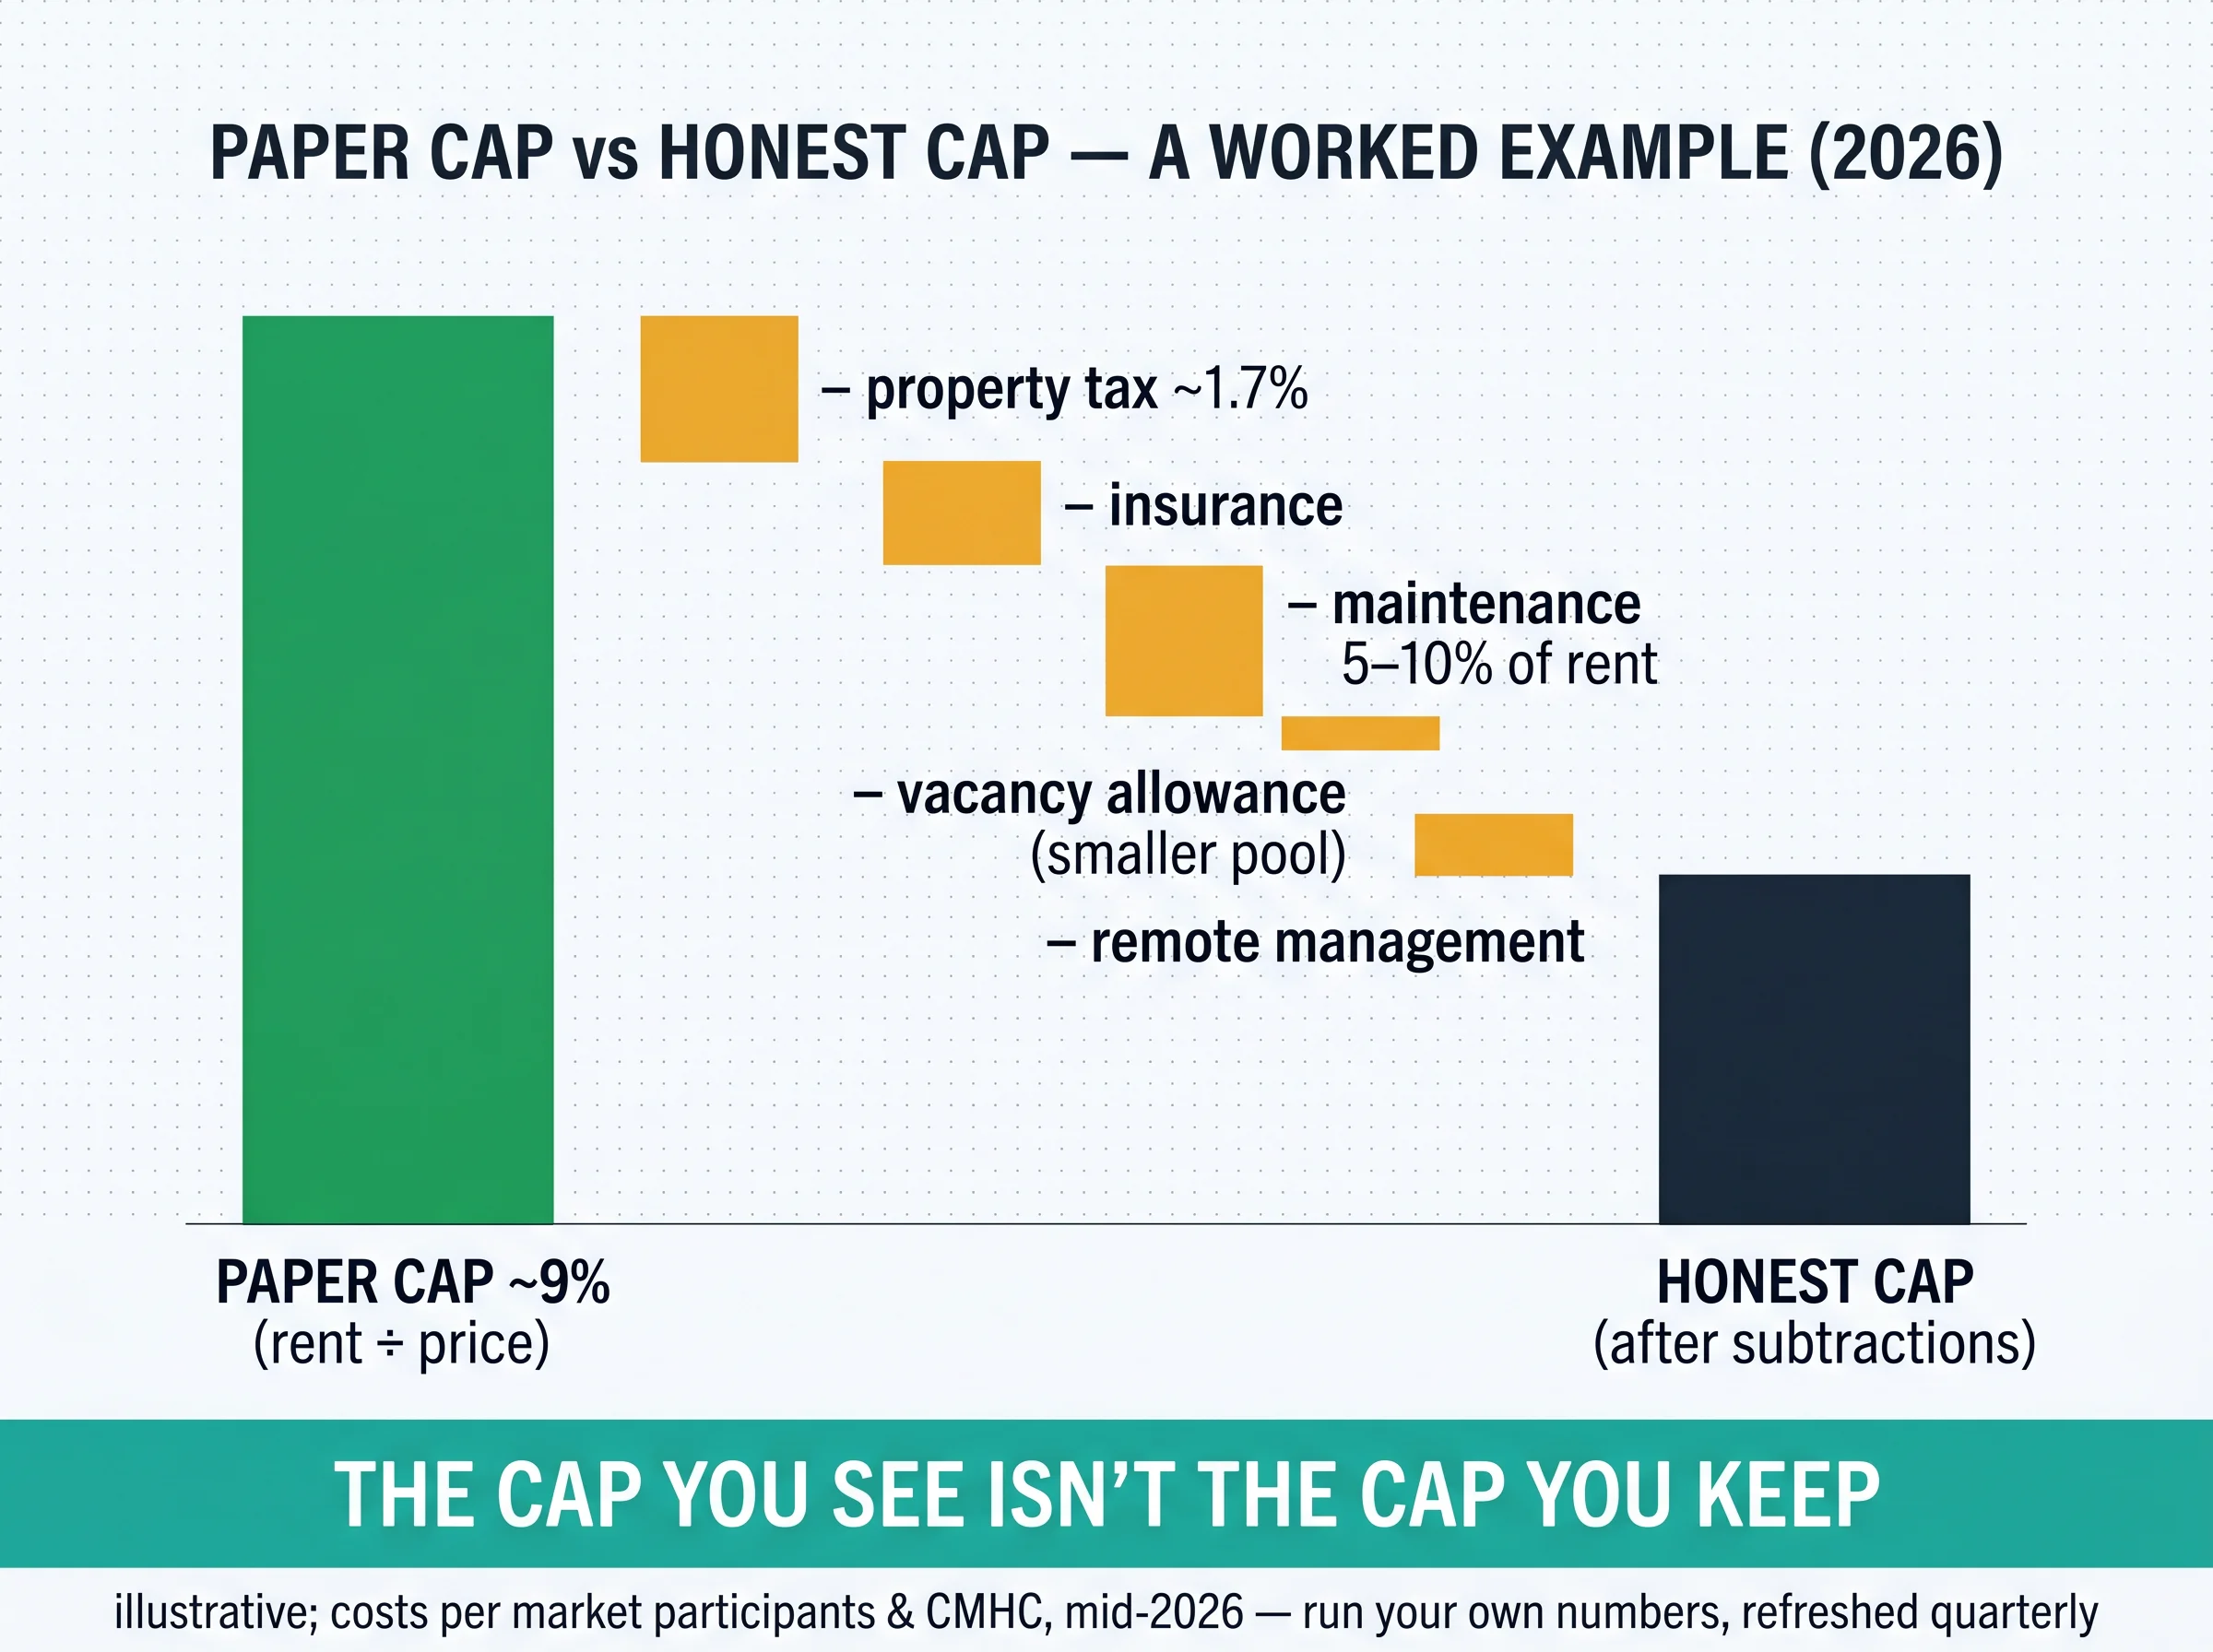
The paper cap — rent divided by price — looks spectacular at northern and border prices. The honest cap has to survive three subtractions the yield tables quietly skip: the property-tax dollar bill (Windsor carries Ontario's single highest rate), single-industry tenant-solvency risk (Windsor's tariff exposure, Sudbury's nickel cycle, Thunder Bay's forestry-and-port economy), and thin-market friction (few comps, weak-segment units that sit for weeks, a smaller renter pool, slower appreciation). This guide runs the honest numbers on all three cities — what actually rents, what the real tax bill does to the cap, and the risks the tables never show — then hands you a stress-tester to run any address yourself. Figures are dated July 2026 and refreshed quarterly; this is market data, not investment advice.
The Cheap-City Cash-Flow Stress-Tester: Paper Cap vs Honest Cap
The fill-in spreadsheet that turns a too-good-to-be-true paper cap into the honest cap you actually keep — with the tax bill, the vacancy shock, and the thin-market friction built in for Windsor, Sudbury, and Thunder Bay.
Get Free PDF →Paper Cap vs Honest Cap: The Three Subtractions
The paper cap is rent divided by price, and at cheap-city prices it looks fantastic. The honest cap is what's left after you subtract the costs that actually leave your account. The universal rules of thumb, drawn from market participants: property tax plus insurance runs about 1% of value a year, maintenance takes 5–10% of rent (older stock at the high end), and your mortgage rate drives cash-on-cash. That last one is the 2022–24 lesson in a sentence — 3–4% cap rates against 5–6% mortgages produced structural negative cash flow even in "good" markets.
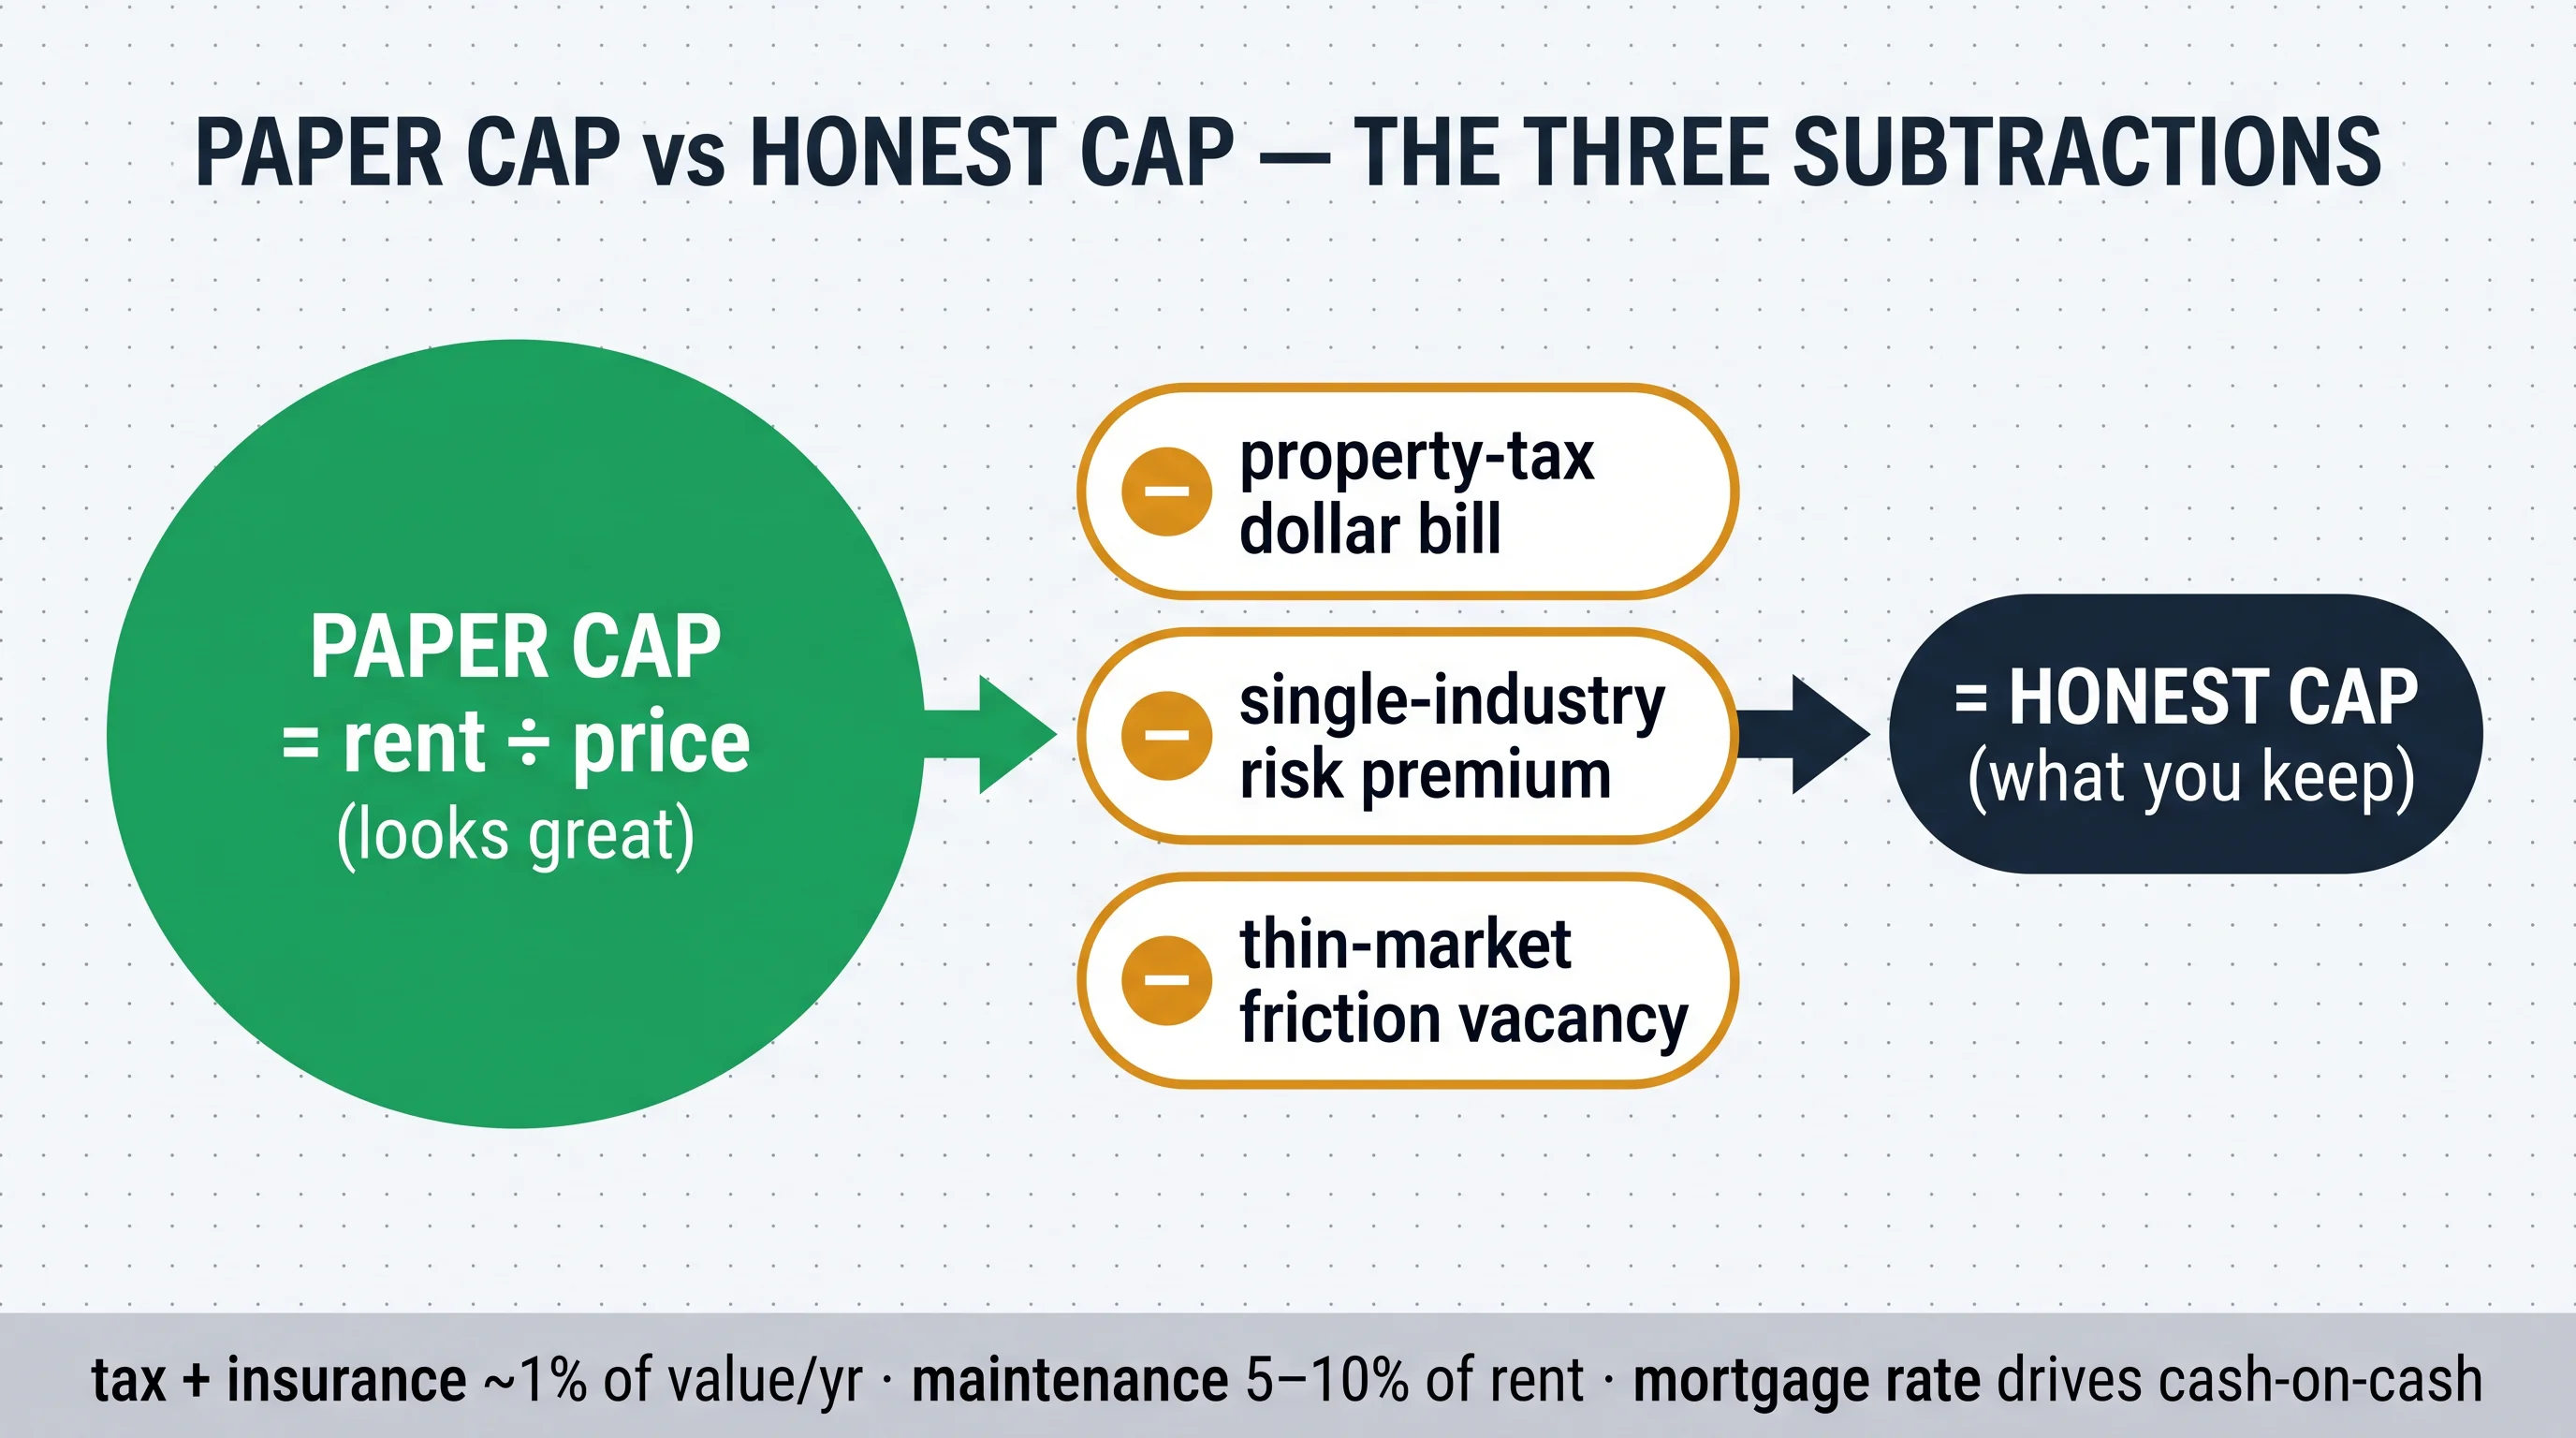
The cross-Canada picture shows both the payoff and its limit. Investor ROI tables put high-cost Toronto around a 4–4.5% cap with cash-on-cash near negative 2%, against cheap Edmonton near a 7.5% cap with cash-on-cash around positive 14% — the cheap-city payoff pattern is real. But the same analysts add the caveat that matters most here: a 7% cap in a smaller market is not automatically superior if the city has weak demographics and limited appreciation. That's the whole argument. The paper cap has to survive three subtractions before you believe it — the tax bill, the single-industry risk, and the thin-market friction — and each of our three cities illustrates one of them most sharply. This is the same honest-numbers discipline our cap rates guide teaches, applied at the cheap end of the ladder.
The Three Cities, Three Cautions
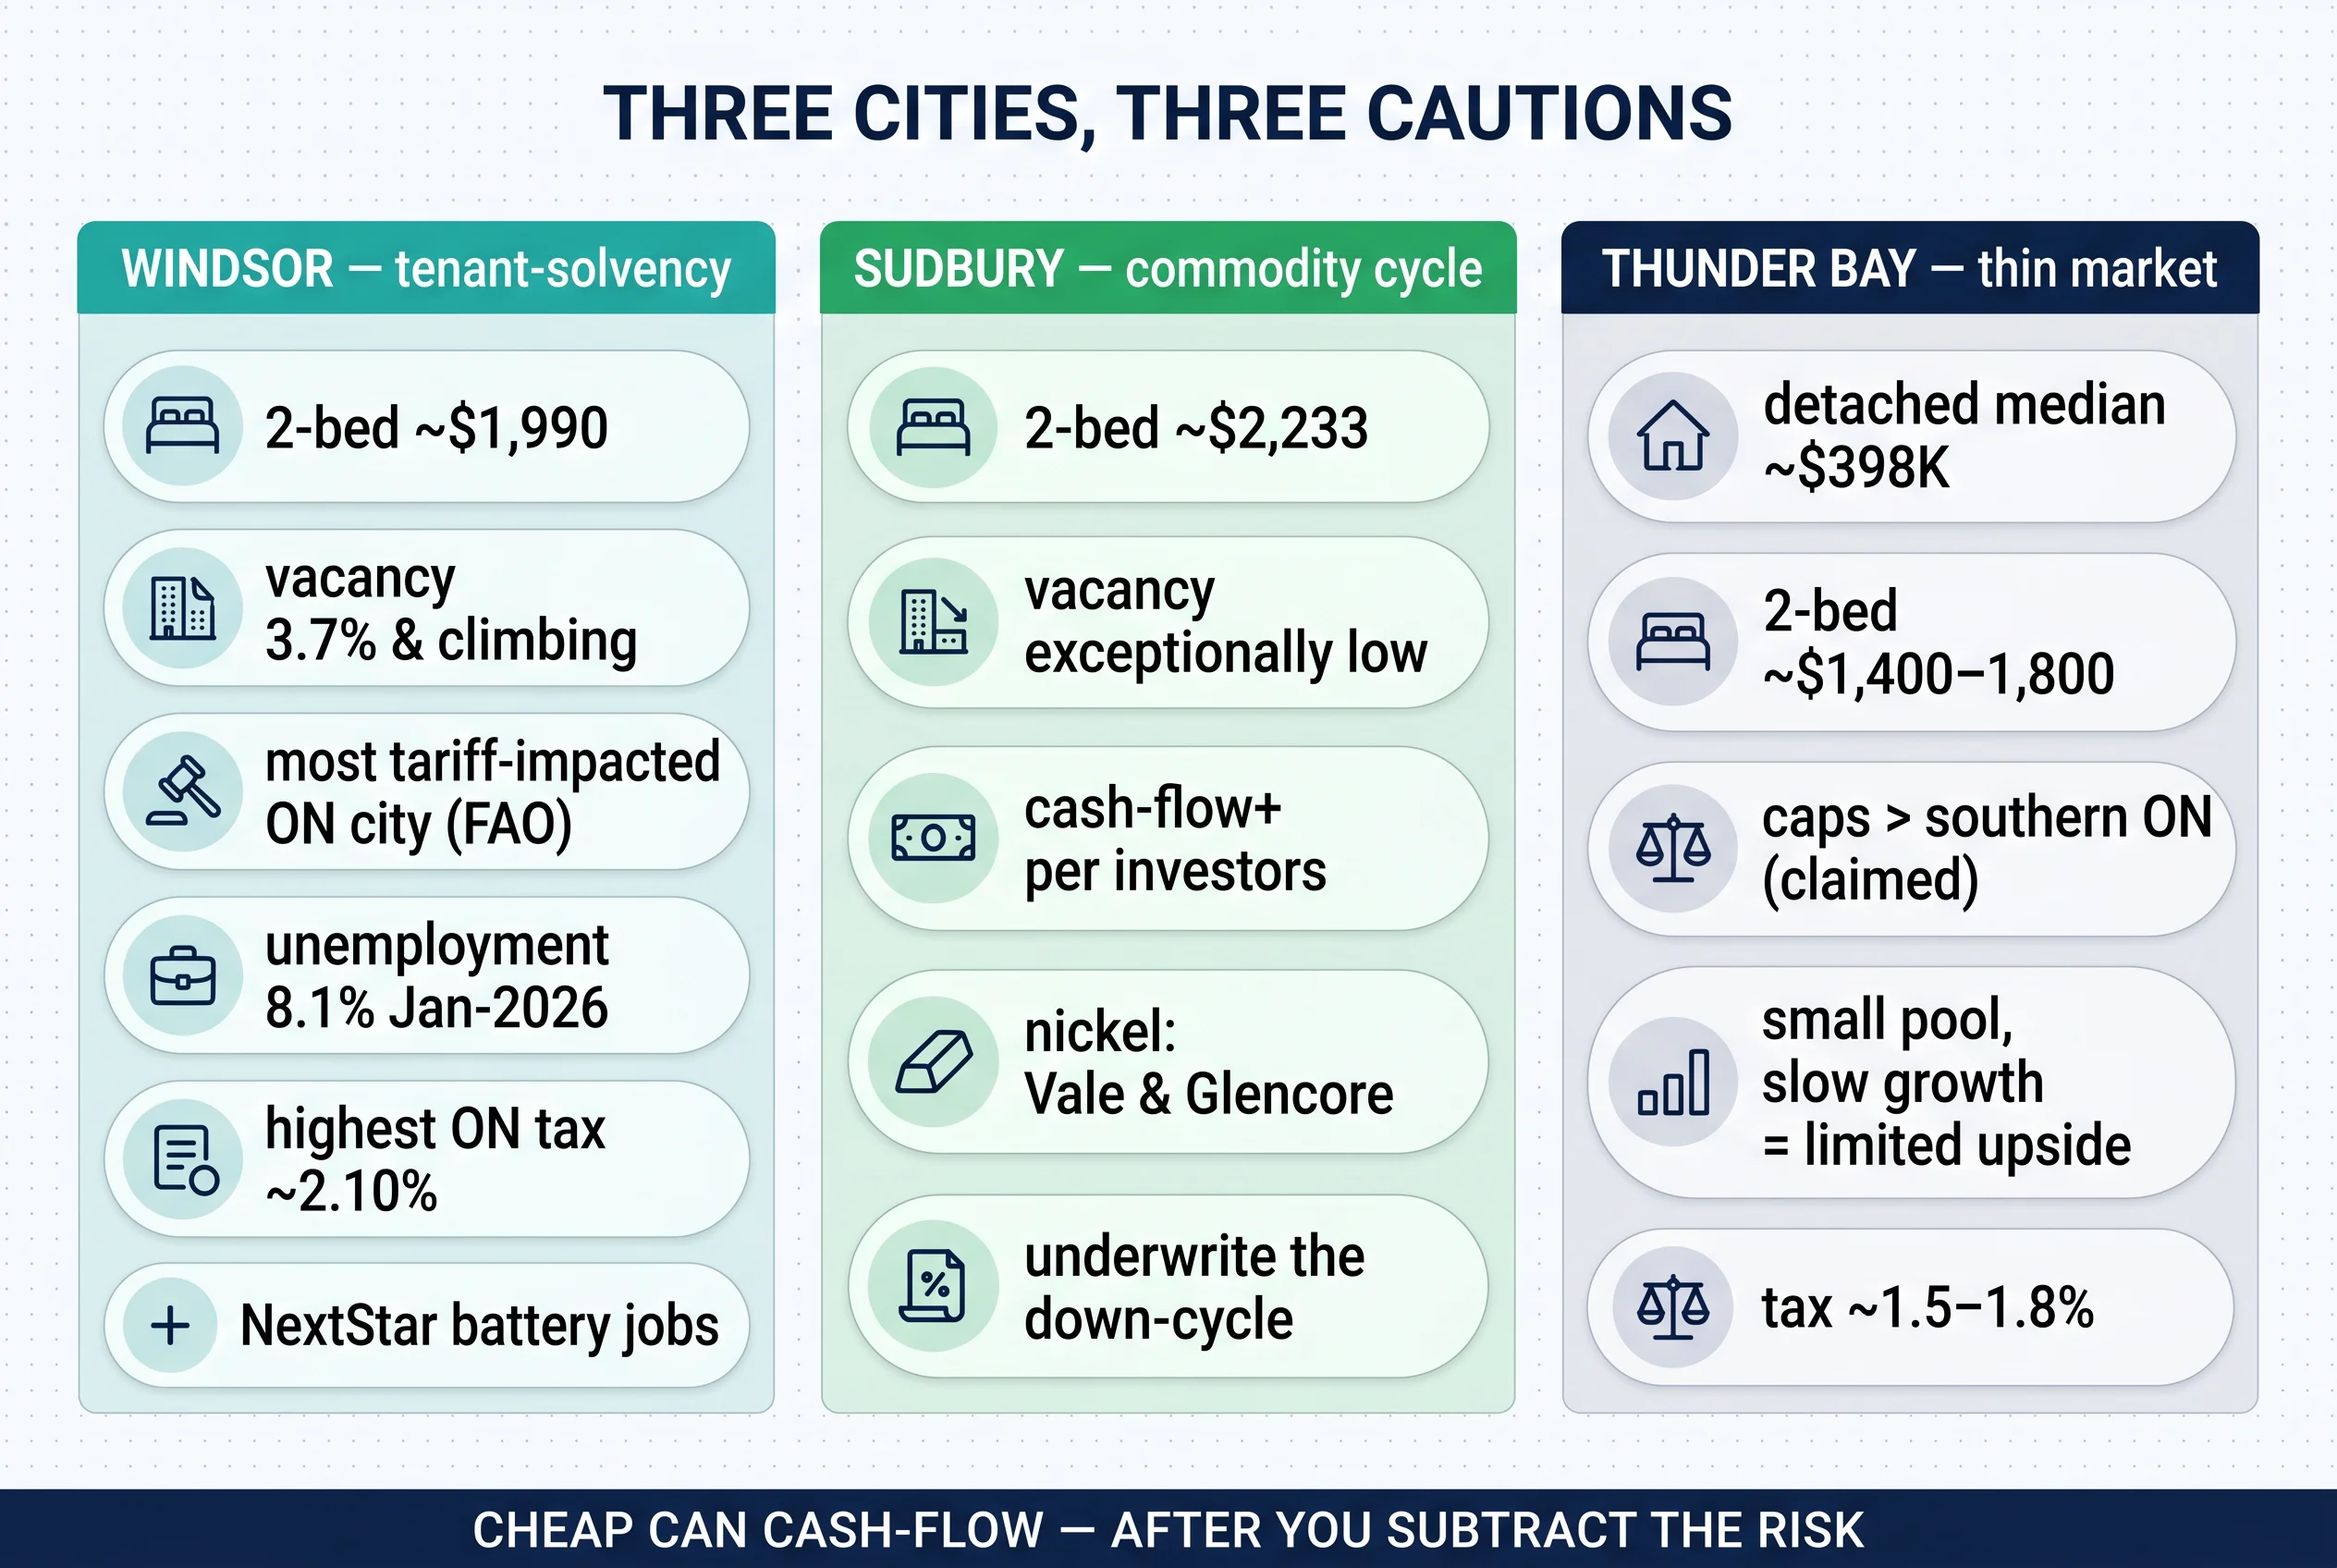
Windsor — the tenant-solvency case. Two-bedroom rents run around $1,990 (condos near $2,100, houses near $1,850), vacancy hit 3.7% in 2025 and is climbing, and here's the signature caution: the Financial Accountability Office projects Windsor as Ontario's most tariff-impacted city, with employment about 1.6% lower in 2026 and unemployment at 8.1% in January 2026, tied to cross-border manufacturing and the 2026 CUSMA review. When a single industry wobbles, it shows up as arrears and turnover — in the rent roll, not the purchase price. The counter-current, and it's real: the NextStar battery plant (around 2,500 jobs at capacity) is a new-demand story. And Windsor carries Ontario's highest residential property-tax rate, near 2.10% — the tax-bite headliner we'll come back to.
Sudbury — the tight-but-cyclical case. Rents average around $1,875 (two-bedrooms near $2,233), vacancy is the tightest of the three — described by local sources as exceptionally low — and investors report being drawn to cash-flow-positive northern properties even after expenses. The caution rides underneath that tightness: Sudbury is the global nickel capital (Vale and Glencore), so the tenant base and the low vacancy both track a commodity cycle. Underwrite the down-cycle, not just today's peak.
Thunder Bay — the thin-market case. The detached median sits around $398K (up 5.4% year-over-year, in a firm seller's market at 2.2 months of inventory and a 14-day median days-on-market), two-bedroom rents run roughly $1,400–1,800, and cap rates the local sources themselves call more attractive than southern Ontario. But those same sources flag the catch plainly: a smaller renter pool and slower population growth limit both the upside and the appreciation. Add a ~1.5–1.8% tax rate — a $300K home runs roughly $4,500–5,400 a year — and the frank headline yield needs the honest-cap treatment like anywhere else.
The Tax Bite at the Cheap End — and the Nuance
All three cities sit near the province's top property-tax rates, and Windsor's roughly 2.10% is the highest in Ontario — about triple Markham's ~0.70%. On a $400K Windsor home that's around $8,400 a year, straight out of net operating income.
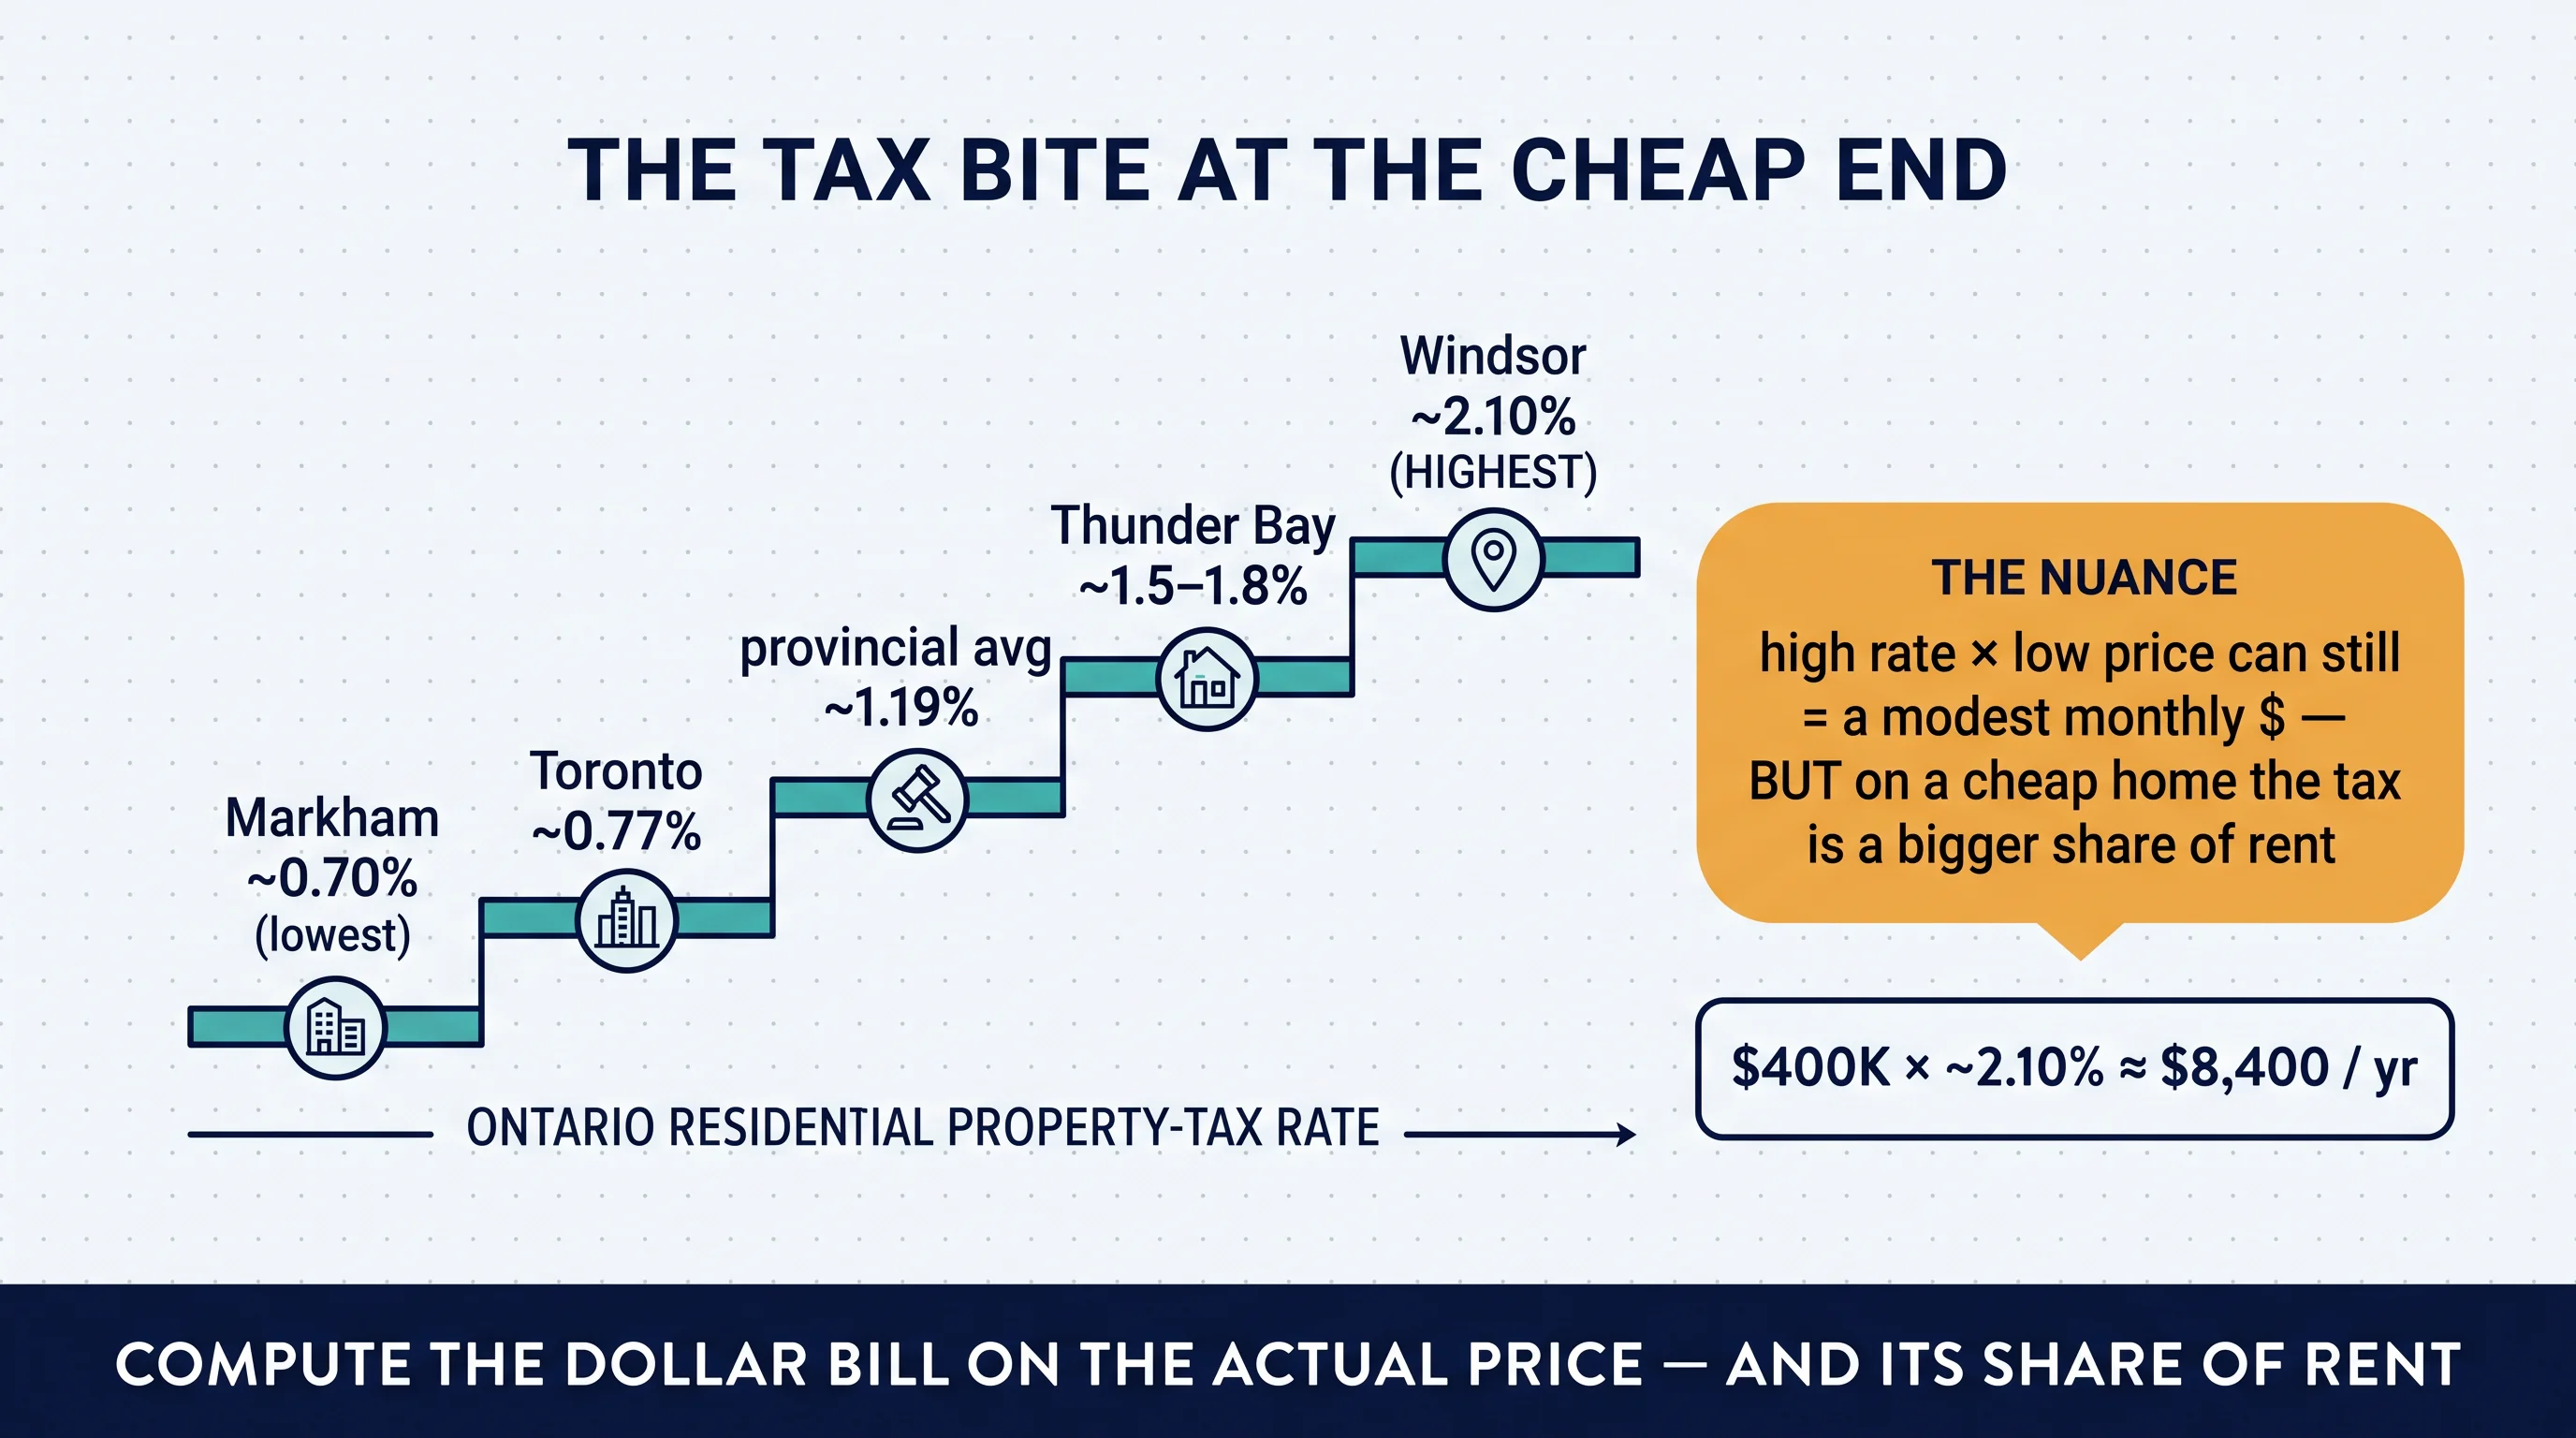
Now the nuance that makes you a sharper underwriter. A high rate on a low price can still produce a modest monthly dollar bill compared with a low-rate, high-price city — the rate-versus-bill relationship from our property-tax rates guide, now cutting the other way. So don't fear the rate in isolation; compute the dollar bill on the actual price. But here's the catch that keeps it honest: on a cheap home, that tax is a bigger share of the rent, so it eats more of your cap than the same dollars would in a pricier city. Underwrite the dollar bill and its ratio to rent — both, not either. And mind the assessment trap: MPAC's values still sit on a January 1, 2016 base, so the assessed value isn't the price you paid, especially where prices have jumped like Thunder Bay's double-digit year-over-year move. Budget for reassessment.
The Data Conflicts, the Rules, and What to Do
These markets publish conflicting numbers, and you need to expect it. Windsor's two-bedroom rent growth shows up as both up 2.1% and up 7.6% for the same year; Sudbury's as both down 6% and up 5.7%. Neither figure is a lie — they're different samples and methods (a survey versus current listings, a median versus an average, one universe versus another). But neither is your property. Use your own last-30-day comparables for the exact sub-market and unit type, the same discipline our rents-by-bedroom guide applies to the gap between sitting and asking rent.
The thin-market friction is concrete, too: operators describe a clear split between units that lease in days and units that sit for weeks, decided by pricing accuracy, presentation, and response speed. In a smaller market with fewer comps, that friction is bigger — and a remote owner feels it most. The rules that travel are the familiar ones: the 2.1% guideline for 2026 on Form N1, the post-November-15-2018 exemption served on the N2 (which matters in heavy vacancy-decontrol markets like Windsor, where units reset to market on turnover), the standard lease, last-month's-rent-only deposits, no late fees, and the $20 NSF cap — all in our Ontario LTB forms hub. Confirm each city's rental-housing and property-standards rules at its own municipal site before you offer, and if you're newer to this, our guides to buying your first rental and becoming a landlord in Ontario cover the base. The value-market cousins — Hamilton and London — run the same honest-cap math one rung up the price ladder.
Practical Takeaways
- Start from the honest cap, not the paper cap — subtract the tax bill, insurance, maintenance (5–10% of rent), and a realistic vacancy allowance before you believe any yield.
- Compute the property-tax dollar bill on the actual price (Windsor's rate is the province's highest) and check it as a share of rent.
- Price the single-industry risk — Windsor's tariff exposure, Sudbury's nickel cycle, Thunder Bay's forestry-and-port base — into your vacancy and arrears assumptions.
- Underwrite the down-cycle, not just today's tight vacancy.
- Use your own last-30-day comps and ignore conflicting headline growth rates.
- Budget the thin-market friction — longer lease-up in weak segments, fewer comps, remote-management cost.
- Re-read next quarter, because tariff and commodity conditions move fast.
Quick win: run one candidate address through the cash-flow stress-tester tonight, tax bill and vacancy included. Long-term: the discipline is the moat — anyone can read a paper cap, but the investor who subtracts honestly keeps the yield.
The Cheap-City Cash-Flow Stress-Tester: Paper Cap vs Honest Cap
The fill-in spreadsheet that turns a too-good-to-be-true paper cap into the honest cap you actually keep — with the tax bill, the vacancy shock, and the thin-market friction built in for Windsor, Sudbury, and Thunder Bay.
Get Free PDF →Cheap Can Cash-Flow — After You Subtract the Risk
Cheap Ontario cities can cash-flow where the GTA can't — but only after the paper cap survives the three subtractions. Windsor pays the highest tax rate in the province and carries its sharpest single-industry exposure; Sudbury is genuinely tight but rides a nickel cycle; Thunder Bay offers the most attractive headline yields with the frankest caveat, a small renter pool and limited appreciation stated by its own sources. None of that makes them bad buys. It makes them buys you have to underwrite honestly. Compute the dollar tax bill, price the single-industry risk, budget the thin-market friction, and use your own comps — then the yield you keep is real, not just the yield you were quoted. Figures July 2026, refreshed quarterly; market data, not investment advice.
Subtract It, Then Run It Properly
Per-unit books that track the deductible property-tax line, rent collection with instant receipts, and Ontario's rules built into every workflow — free for up to 3 units on Tenon10.
Free plan available • Tenants always free • Ontario compliance in code
Related Resources
The Cities & Markets series: Best Ontario Cities to Buy a Rental Property — where these three sit in the provincial picture · Property Tax Rates Across Ontario Cities — the rate-vs-bill method behind the tax bite · Cap Rates & Average Rents and Average Rents by Bedroom — the honest-cap and two-rents methods · the value-market city guides for Hamilton and London.
The rules underneath: Ontario Rent Increases 2026: The Complete N1 Guide · the N1 and N2 forms · the rent increase calculator · the Ontario LTB forms hub.
Getting started: Buying Your First Rental Property in Ontario · Becoming a Landlord in Ontario: The First-Timer's Guide · Landlord Insurance in Ontario.
Frequently Asked Questions
Do cheap Ontario cities like Windsor, Sudbury, and Thunder Bay actually cash-flow?
They can — more readily than Toronto or the GTA, where compressed cap rates against current mortgage rates often produce negative cash flow — but only after you run the honest numbers. The paper cap (rent divided by price) looks excellent at these prices, and local investors do quote positive cash flow, especially in Sudbury and Thunder Bay. The honest cap has to survive three subtractions: the property-tax dollar bill (Windsor carries Ontario's highest residential rate, and the northern cities aren't far behind), single-industry tenant-solvency risk (Windsor's cross-border manufacturing exposure, Sudbury's nickel cycle, Thunder Bay's forestry-and-port base), and thin-market friction (fewer comps, weak-segment units that sit for weeks, a smaller renter pool, slower appreciation). Subtract all three, use your own last-30-day comps, and the cash flow that remains is real. Market data, not investment advice.
Is Windsor a good place to buy a rental property?
Windsor offers genuinely low entry prices and rents that have shown pricing power, plus a new-demand story in the NextStar battery plant. But it carries two disciplines you can't skip. First, the Financial Accountability Office projects Windsor as Ontario's most tariff-impacted city, with employment about 1.6% lower in 2026 and unemployment at 8.1% in January 2026 — a single-industry exposure that shows up as arrears and turnover risk when cross-border manufacturing wobbles, not in the sticker price. Second, Windsor levies Ontario's highest residential property-tax rate (around 2.10%), roughly $8,400 a year on a $400K home, straight out of net operating income. Neither is a reason to avoid Windsor; both are reasons to underwrite conservatively — price the tenant-solvency risk into your vacancy and arrears assumptions, and put the real tax dollar bill in the pro forma.
Which is better for cash flow: Sudbury or Thunder Bay?
They're different cases, and neither is universally better. Sudbury runs the tighter market — vacancy is exceptionally low and investors report cash-flow-positive properties even after expenses — but its tenant base and that tightness ride the nickel-mining cycle (Vale and Glencore), so you should underwrite the down-cycle, not just today's peak. Thunder Bay offers the more affordable entry (a detached median around $398K) and cap rates its own sources call more attractive than southern Ontario, but those same sources flag the catch: a smaller renter pool and slower population growth limit both upside and appreciation, and the ~1.5–1.8% tax rate adds carrying cost. Sudbury is the tighter-today market with commodity risk; Thunder Bay is the cheaper-entry market with thin-market risk. Run both through the same honest-cap math on your own comps before choosing.
Why do cheap cities have such high property tax rates?
Because a municipality has to raise a similar amount of revenue for similar services regardless of local home values — so a city with lower average prices applies a higher rate to collect it. That's why Windsor's rate (~2.10%) is roughly triple Markham's (~0.70%). Here's the nuance that matters for investors: a high rate on a low-priced home can still produce a modest monthly dollar bill compared with a low-rate, high-price city — so don't fear the rate in isolation, compute the actual dollar bill on the actual price. But the catch keeps it honest: on a cheap home, that tax is a larger share of the rent, so it eats more of your cap than the same dollars would in a pricier market. Always underwrite the dollar amount and its ratio to rent, not the headline rate.
What's the biggest mistake investors make in these markets?
Believing the paper cap. The single most common error is taking rent-divided-by-price at face value and skipping the three subtractions that turn it into an honest cap: the tax dollar bill, the single-industry risk premium, and the thin-market friction. Close behind is trusting a headline growth rate — these markets routinely show conflicting figures (Windsor's two-bedroom rents are published as both up 2.1% and up 7.6% for the same year; Sudbury's as both down 6% and up 5.7%), because different sources use different samples and methods. Neither number is a lie, but neither is your property. Use your own last-30-day comparables for the exact sub-market and unit type, underwrite for the down-cycle and for longer lease-up in weak segments, and budget the real cost of managing a property in a smaller market from a distance.
This article presents Ontario rental market data current as of July 14, 2026 and is refreshed quarterly. It provides market information for educational purposes, not investment, legal, or tax advice. Figures are drawn from CMHC (2025 Rental Market Survey; 2026 Outlook), listing platforms, and local market participants; cap rates, "cash-flow positive" claims, rents, and price comparisons are operator claims, presented as such — verify against your own comps and quotes. Economic conditions in these cities, particularly Windsor's tariff exposure and the northern commodity cycles, can change quickly; confirm current employment, tax, and rental-housing rules with the Financial Accountability Office, each city, the Province of Ontario, MPAC, and CMHC before relying on them, and consult licensed professionals — realtor, accountant, lawyer — before making investment decisions.


