

In February 2026, Hamilton's "average rent" was $1,601. Also $1,850. Also $2,000. Also $2,075. Four platforms, one city, one month — and none of them wrong. "What's the average rent?" is an unanswerable question until you specify three variables: which bedroom count, which city, and which data series. Ask it properly and the answers exist; ask it loosely and you'll price a unit, sign a mortgage, or lose a tenant on a number that was never measuring what you thought it was.
The bedroom-type data is out there. CMHC publishes it down to neighbourhood grain with per-cell reliability codes; Statistics Canada runs a quarterly asking-rent series by bedroom count; platforms print monthly. But it lives in an unnavigable portal, methodology-inconsistent pages, and undated listicles — nobody maintains the labelled, dated, both-series matrix. This page is that matrix: studio through three-bedroom for every major Ontario city, both series, every cell dated — plus the three teaches that make it usable: the three-variable question, the ladder's per-bedroom economics, and 2026's bedroom-mix inversion. It's a sibling to our cap-rate data page and feeds the city scorecard. Refreshed quarterly — next October 2026, then December 2026 after the new CMHC survey. General information, not investment advice.
The Ontario Bedroom Rent Matrix: Every City, Every Unit Size, Both Series (XLSX)
The bedroom matrix as a working spreadsheet — studio through 3-bed rents for every major Ontario city in both data series, plus a formula-live unit-pricing worksheet that turns bedroom-matched comps into a defensible list price.
Get Free PDF →The Three-Variable Question: Why Every "Average Rent" Needs a Label
Start with the four Hamiltons. In a single month, four platforms published four different "average rents" for the same city — $1,601, $1,850, $2,000, $2,075 — a 30% spread before anyone even split by bedroom count or data series. Every figure was defensible on its own methodology; none were interchangeable. A landlord pricing a vacant unit off the highest screenshot while their applicant negotiates off the lowest aren't disagreeing about the market — they're reading different instruments and calling them the same name.
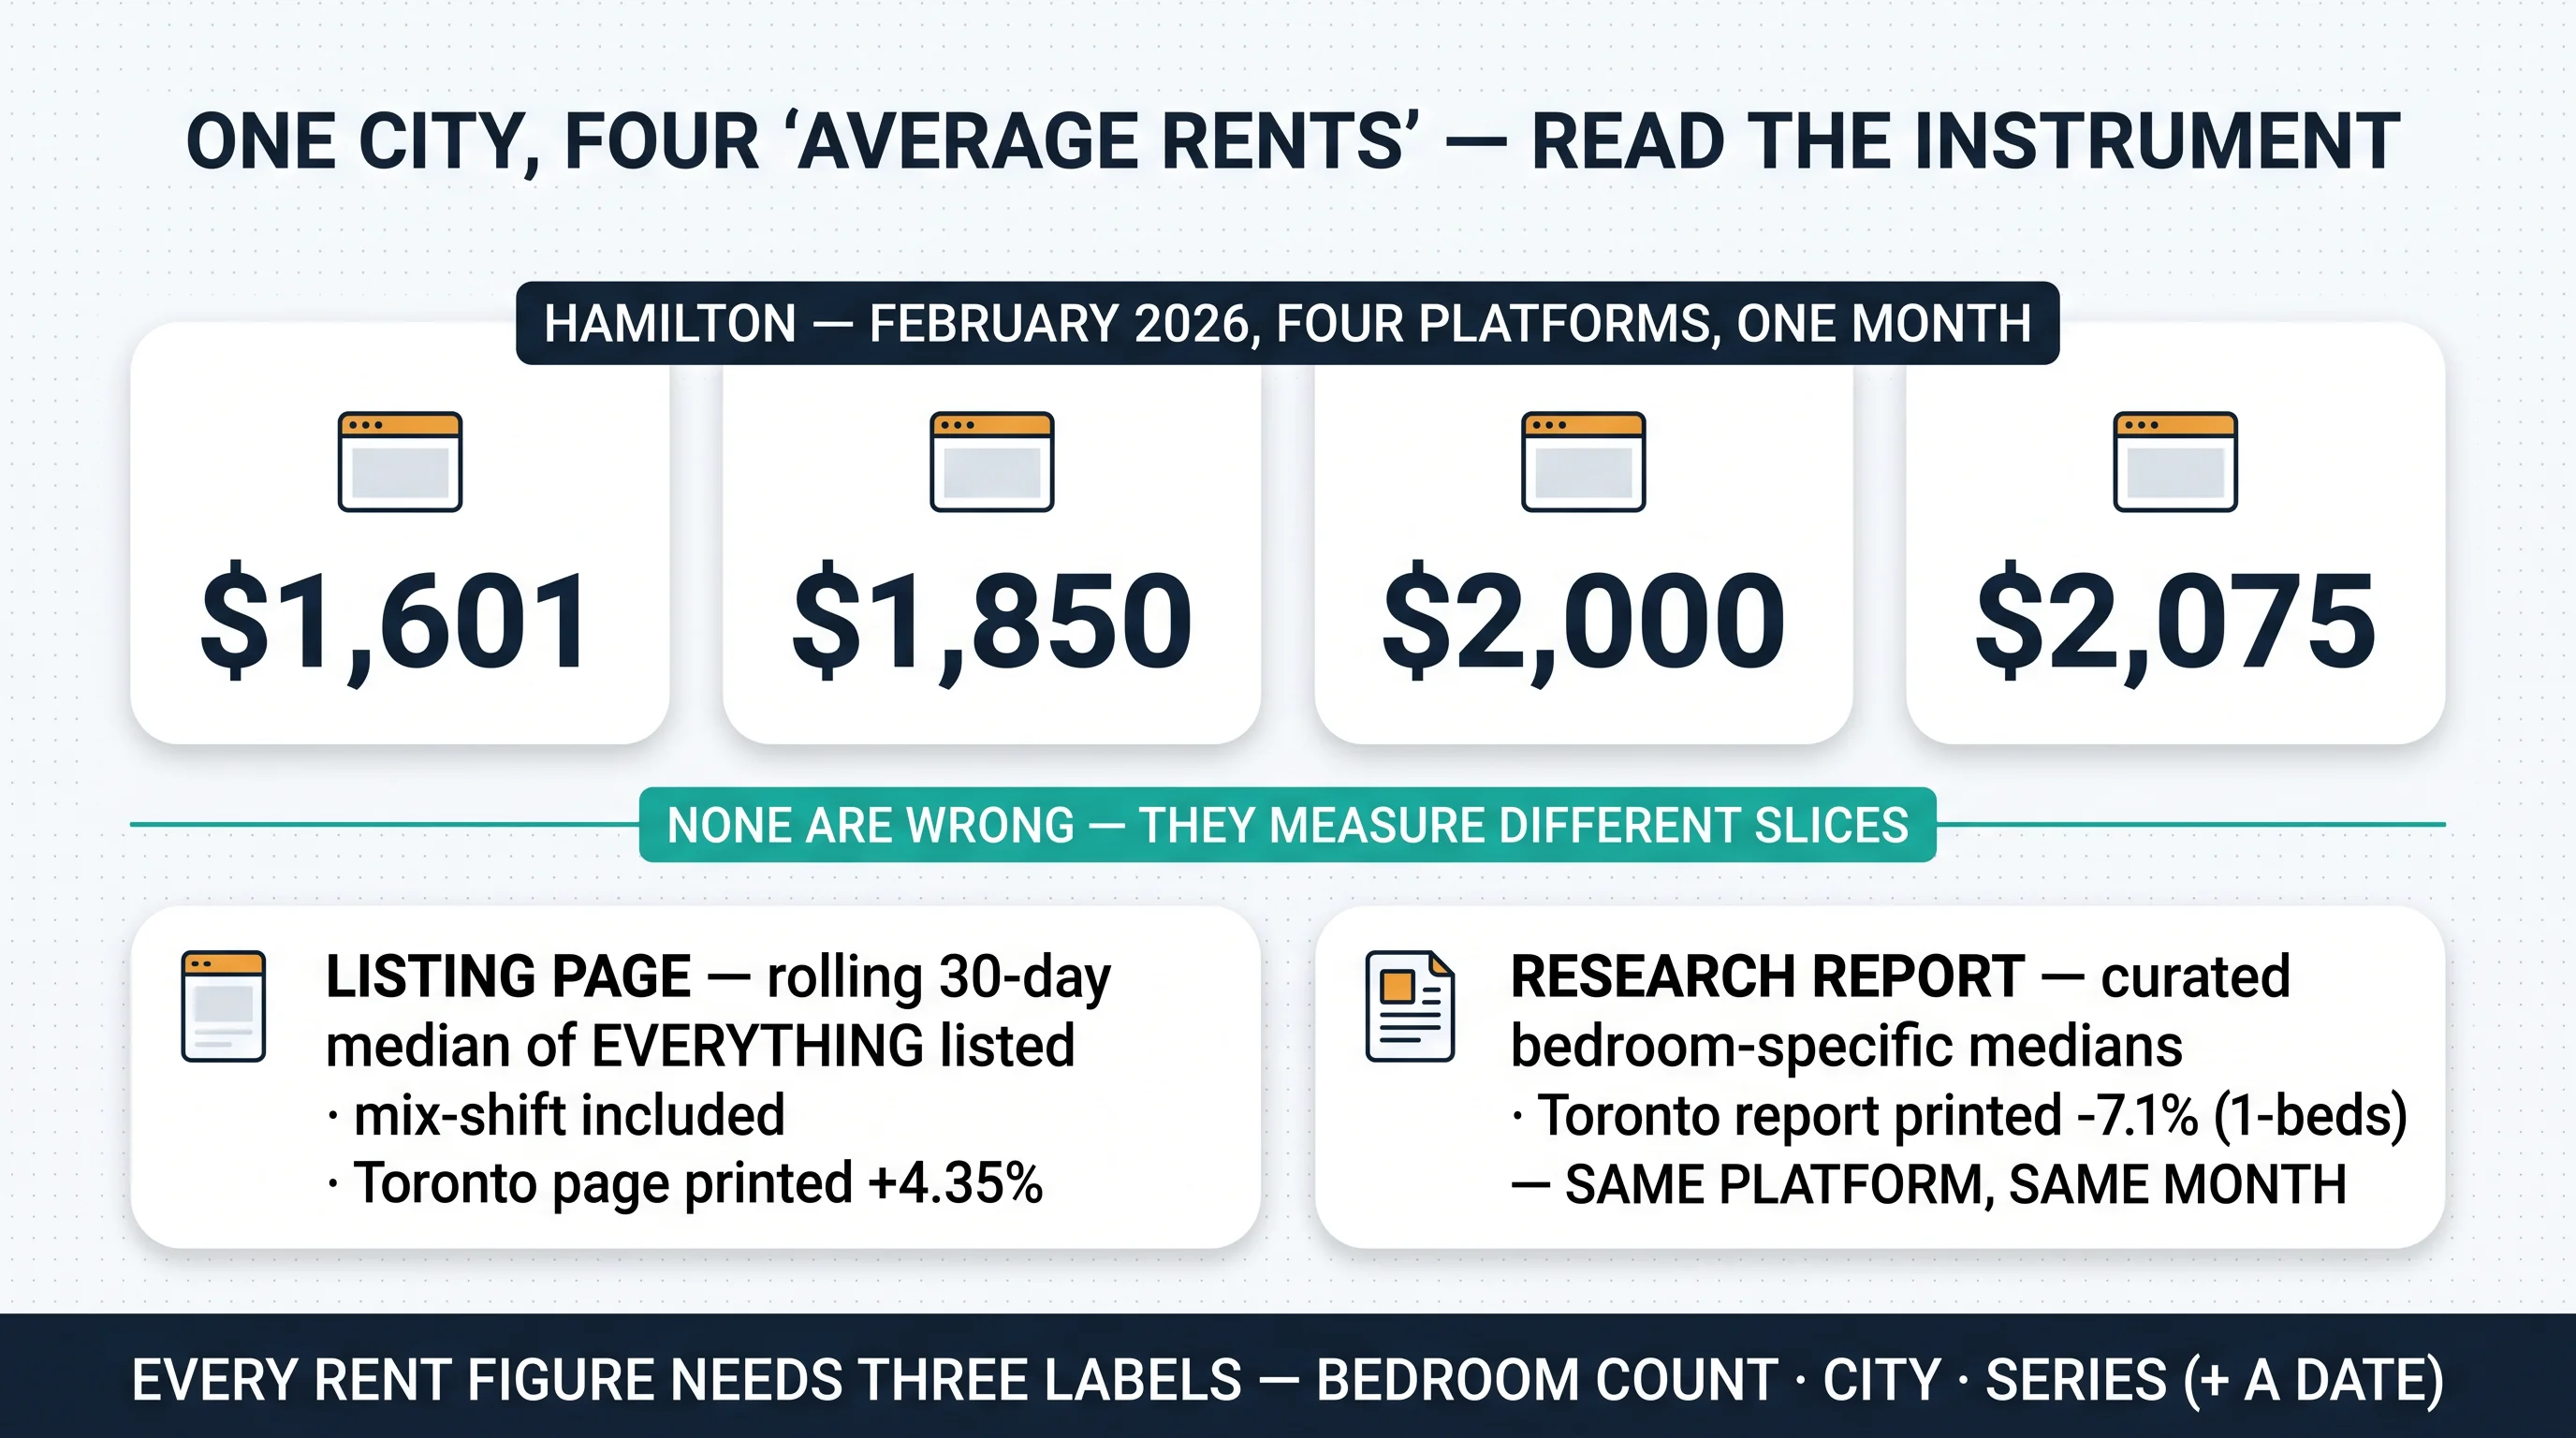
The trap runs deeper than site-to-site differences — it runs within platforms. This month, one major platform's Toronto listing page printed +4.35% year-over-year while that same platform's national research report printed −7.1% on Toronto one-bedrooms. Both were methodologically correct: the page is a rolling 30-day median of everything listed, mix-shift included — a month heavy in luxury listings reads as "rents up" even while like-for-like rents fall — while the report curates bedroom-specific medians. Same company, same city, opposite signs. (A neighbouring 905 city's page printed +21% the same month; that's thin-sample noise, not a boom, and this page won't repeat it as fact.) The rule that survives all of it: read the instrument before the number, and prefer reports over pages.
Then there are the two series this whole workbook is built on, now at bedroom grain. Occupied-stock rents (CMHC's annual survey) measure what sitting tenants actually pay — controlled units included, moving slowly, and notably still rising through early 2025 on turnover repricing even as asking rents fell. Asking rents (StatCan's quarterly program plus platform reports) measure today's vacant-unit price — and they've been falling across most of Ontario. Toronto's two-bedroom tells it in one line: roughly $2,046 occupied versus $2,797+ asking. Both true; different questions. And one more layer nobody else teaches: every cell in CMHC's portal carries a reliability code — a (excellent) through d (use with caution), with ** where data is suppressed. A "d"-rated three-bed average in a small centre is a hint, not a comp. This page carries the codes forward, and the records discipline that beats any screenshot in a dispute lives in our rental-records guide.
The Matrix: Rents by Bedroom and City
How to read it: every cell carries its bedroom count, its series, and its date; blanks say "see the CMHC or StatCan table" rather than inventing a number; and older figures are labelled with their vintage rather than passed off as current.
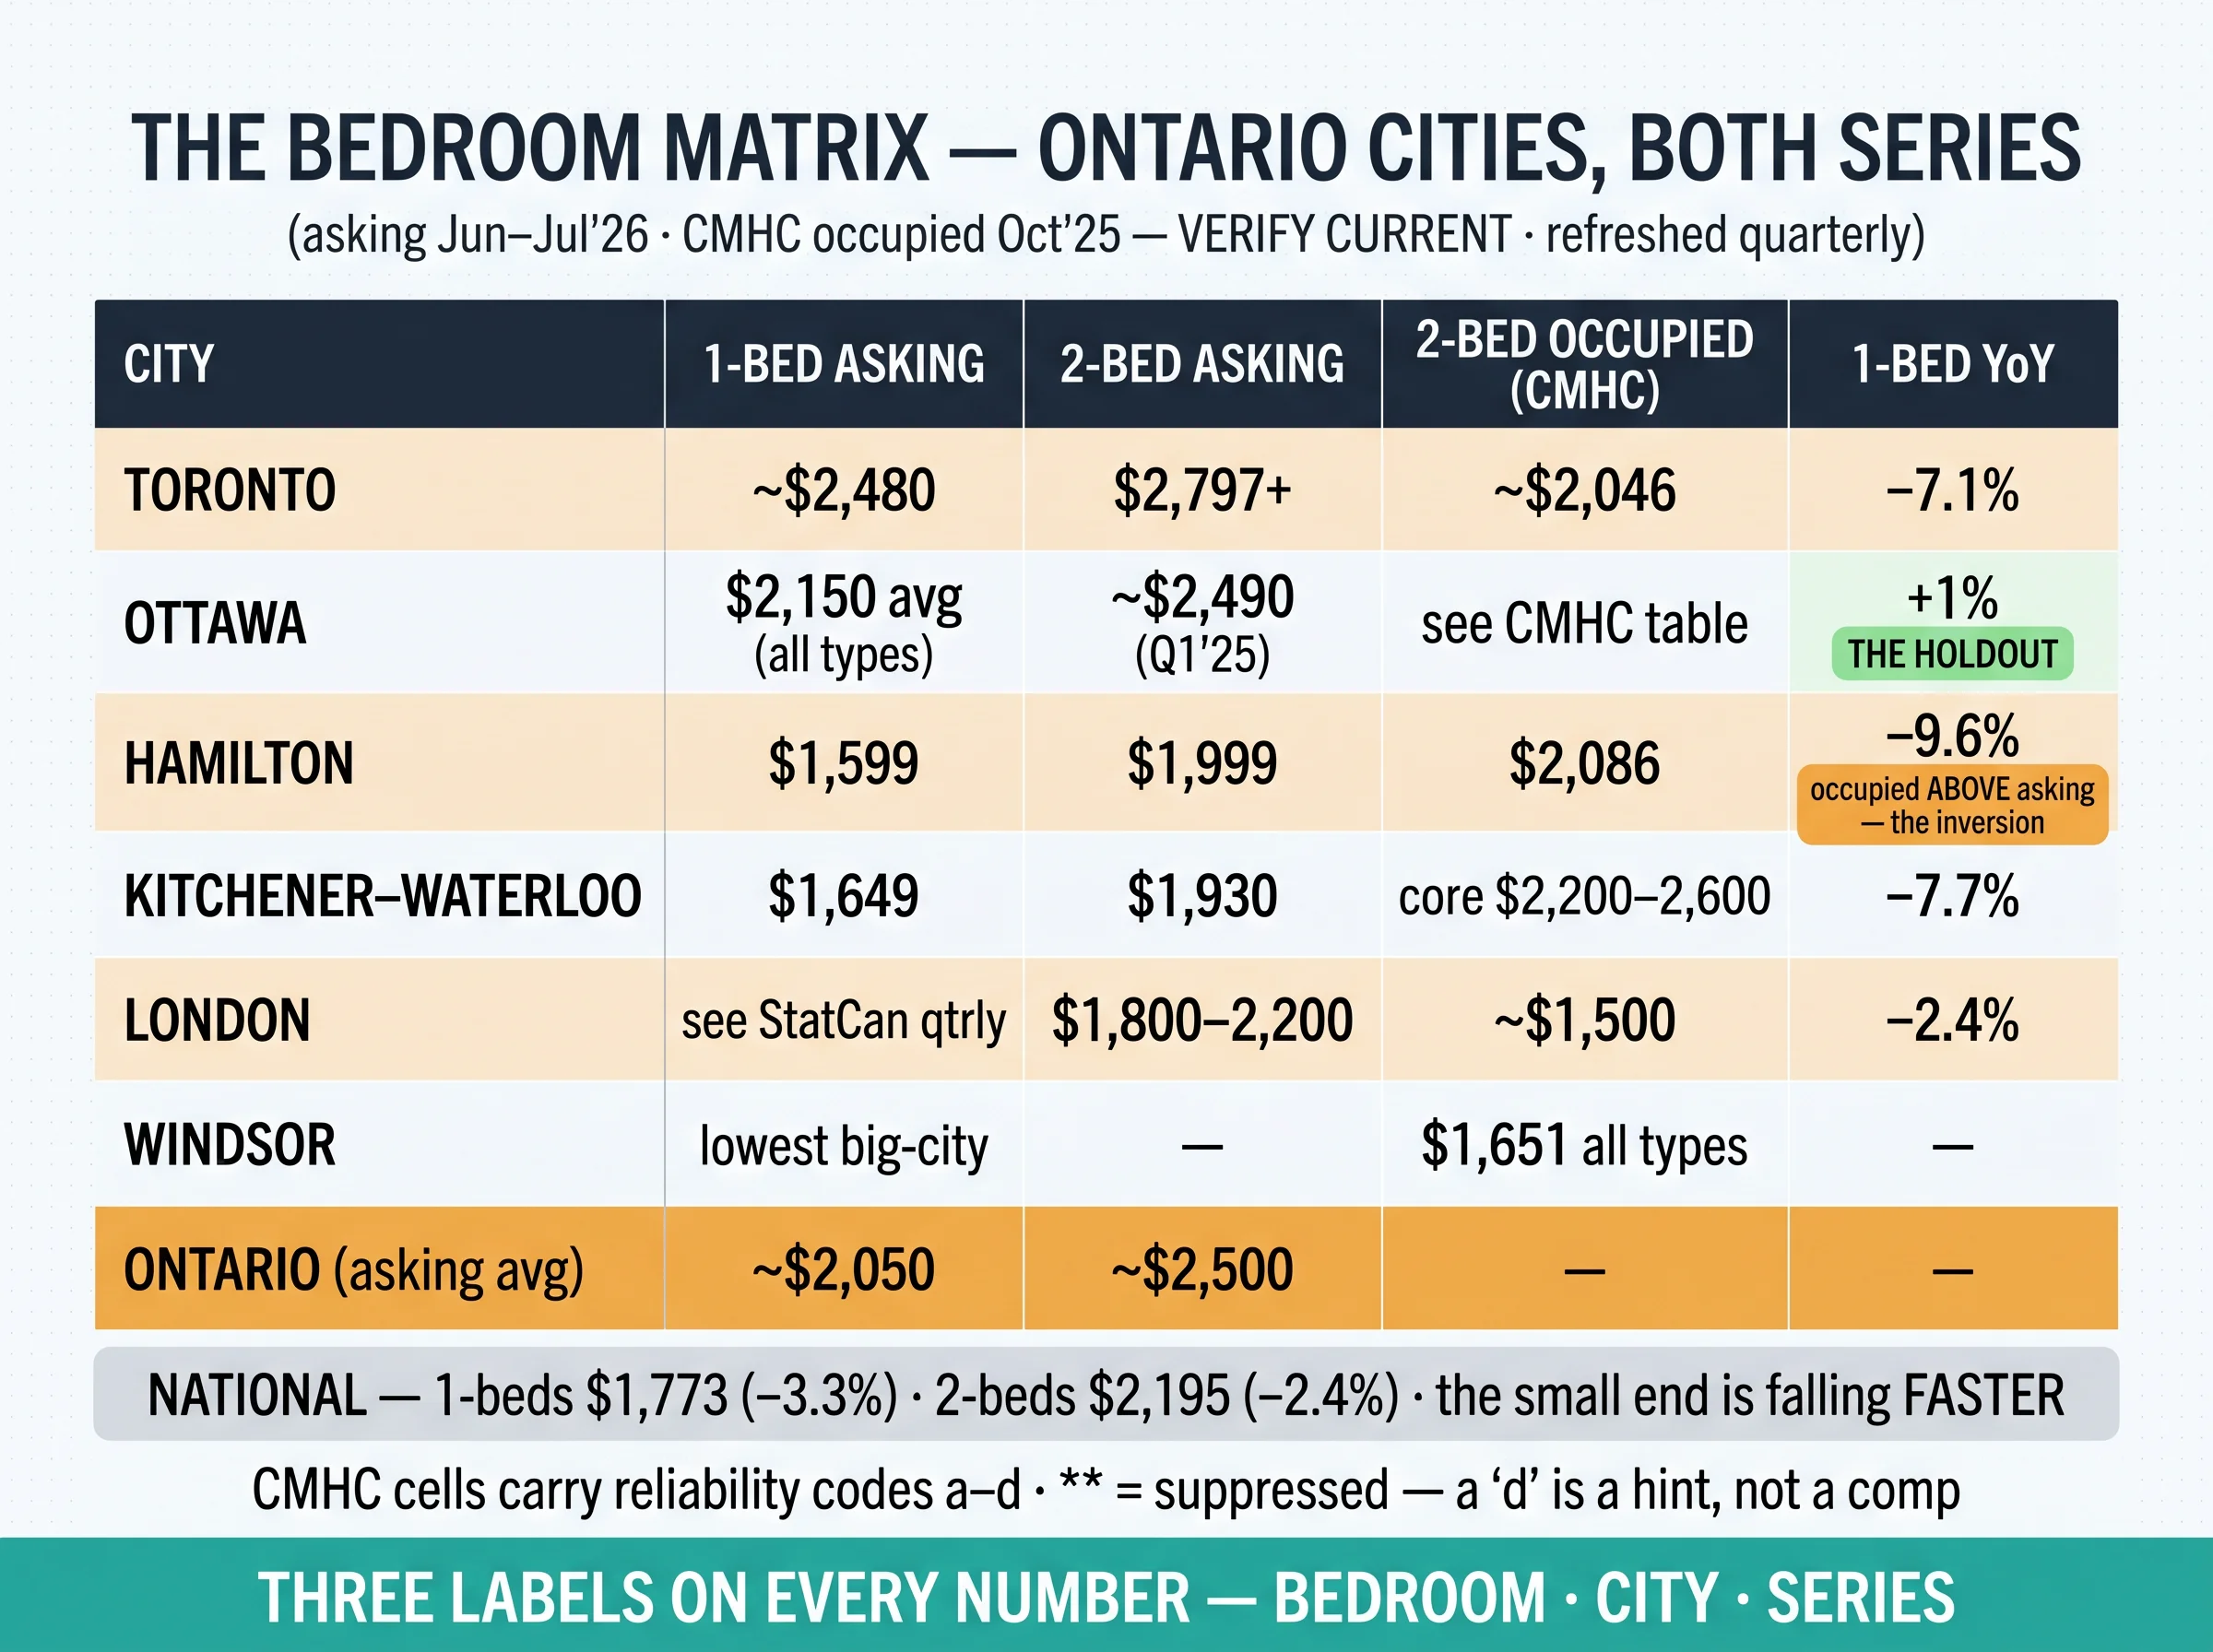
Toronto: one-bed askings around $2,480 (−7.1% year-over-year), two-bed askings printing $2,797 to $3,210 depending on source against an occupied average of ~$2,046, studios around $1,890 on listing-skewed samples, and three-beds at $3,638 — a May 2024 print, explicitly dated, because the segment is too thin for fresh monthly medians. Ottawa: the provincial holdout — $2,150 average asking and +1% year-over-year while every peer fell, with two-bed askings around $2,490 (Q1 2025) and value pockets like Cyrville ($1,738) and Sandy Hill ($1,895). Hamilton: the steepest correction (−9.6% on one-beds) has produced the matrix's strangest row — occupied rents now sit above askings on both bedroom types ($1,753 vs $1,599 on one-beds; $2,086 vs $1,999 on twos). That inversion is what a fast correction does to the two series' usual order: the sitting-tenant average, built up through years of turnover repricing, hasn't caught down to a falling street price. Kitchener–Waterloo: the full exemplar ladder ($1,415 studio through $2,600 for 4+), a −10.3% median year that just printed +1.4% month-over-month — the bottoming signal worth watching — and core occupied two-beds at $2,200–2,600. London: the gentlest correction (−2.4%) over the widest proportional gap — occupied two-beds around $1,500 against askings of $1,800–2,200. Windsor: $1,651 occupied all-types, the lowest big-city figure. The 905: Mississauga −2.8%; Brampton's page print flagged as noise above. Ontario as a whole: roughly $2,050 one-bed and $2,500 two-bed on asking averages, pulled up by the GTA — against a national backdrop of $1,773 one-beds (−3.3%) and $2,195 two-beds (−2.4%).
City-level averages are where analysis starts, not where it ends — the neighbourhood-grain versions of these questions live in our Toronto neighbourhoods guide, the yield language in the cap-rate table, and the property-tax comparison joins the data siblings later this sprint.
The Ladder: Per-Bedroom Economics Every Landlord Should Run
Kitchener's July 2026 asking ladder is the cleanest exemplar in the province: studio $1,415 → one-bed $1,649 → two-bed $1,930 → three-bed $2,200 → four-plus $2,600. Two structural facts hide in every city's version of that progression. First, each step up costs the tenant less per bedroom: $1,649 per bedroom living alone, $965 sharing a two-bed, $733 each in a three-bed. Second — and directly because of the first — shared-living demand climbs the ladder when affordability tightens, which is CMHC's own forward call for this market. The per-bedroom discount that makes big units cheaper for tenant groups is precisely what makes them resilient for owners.
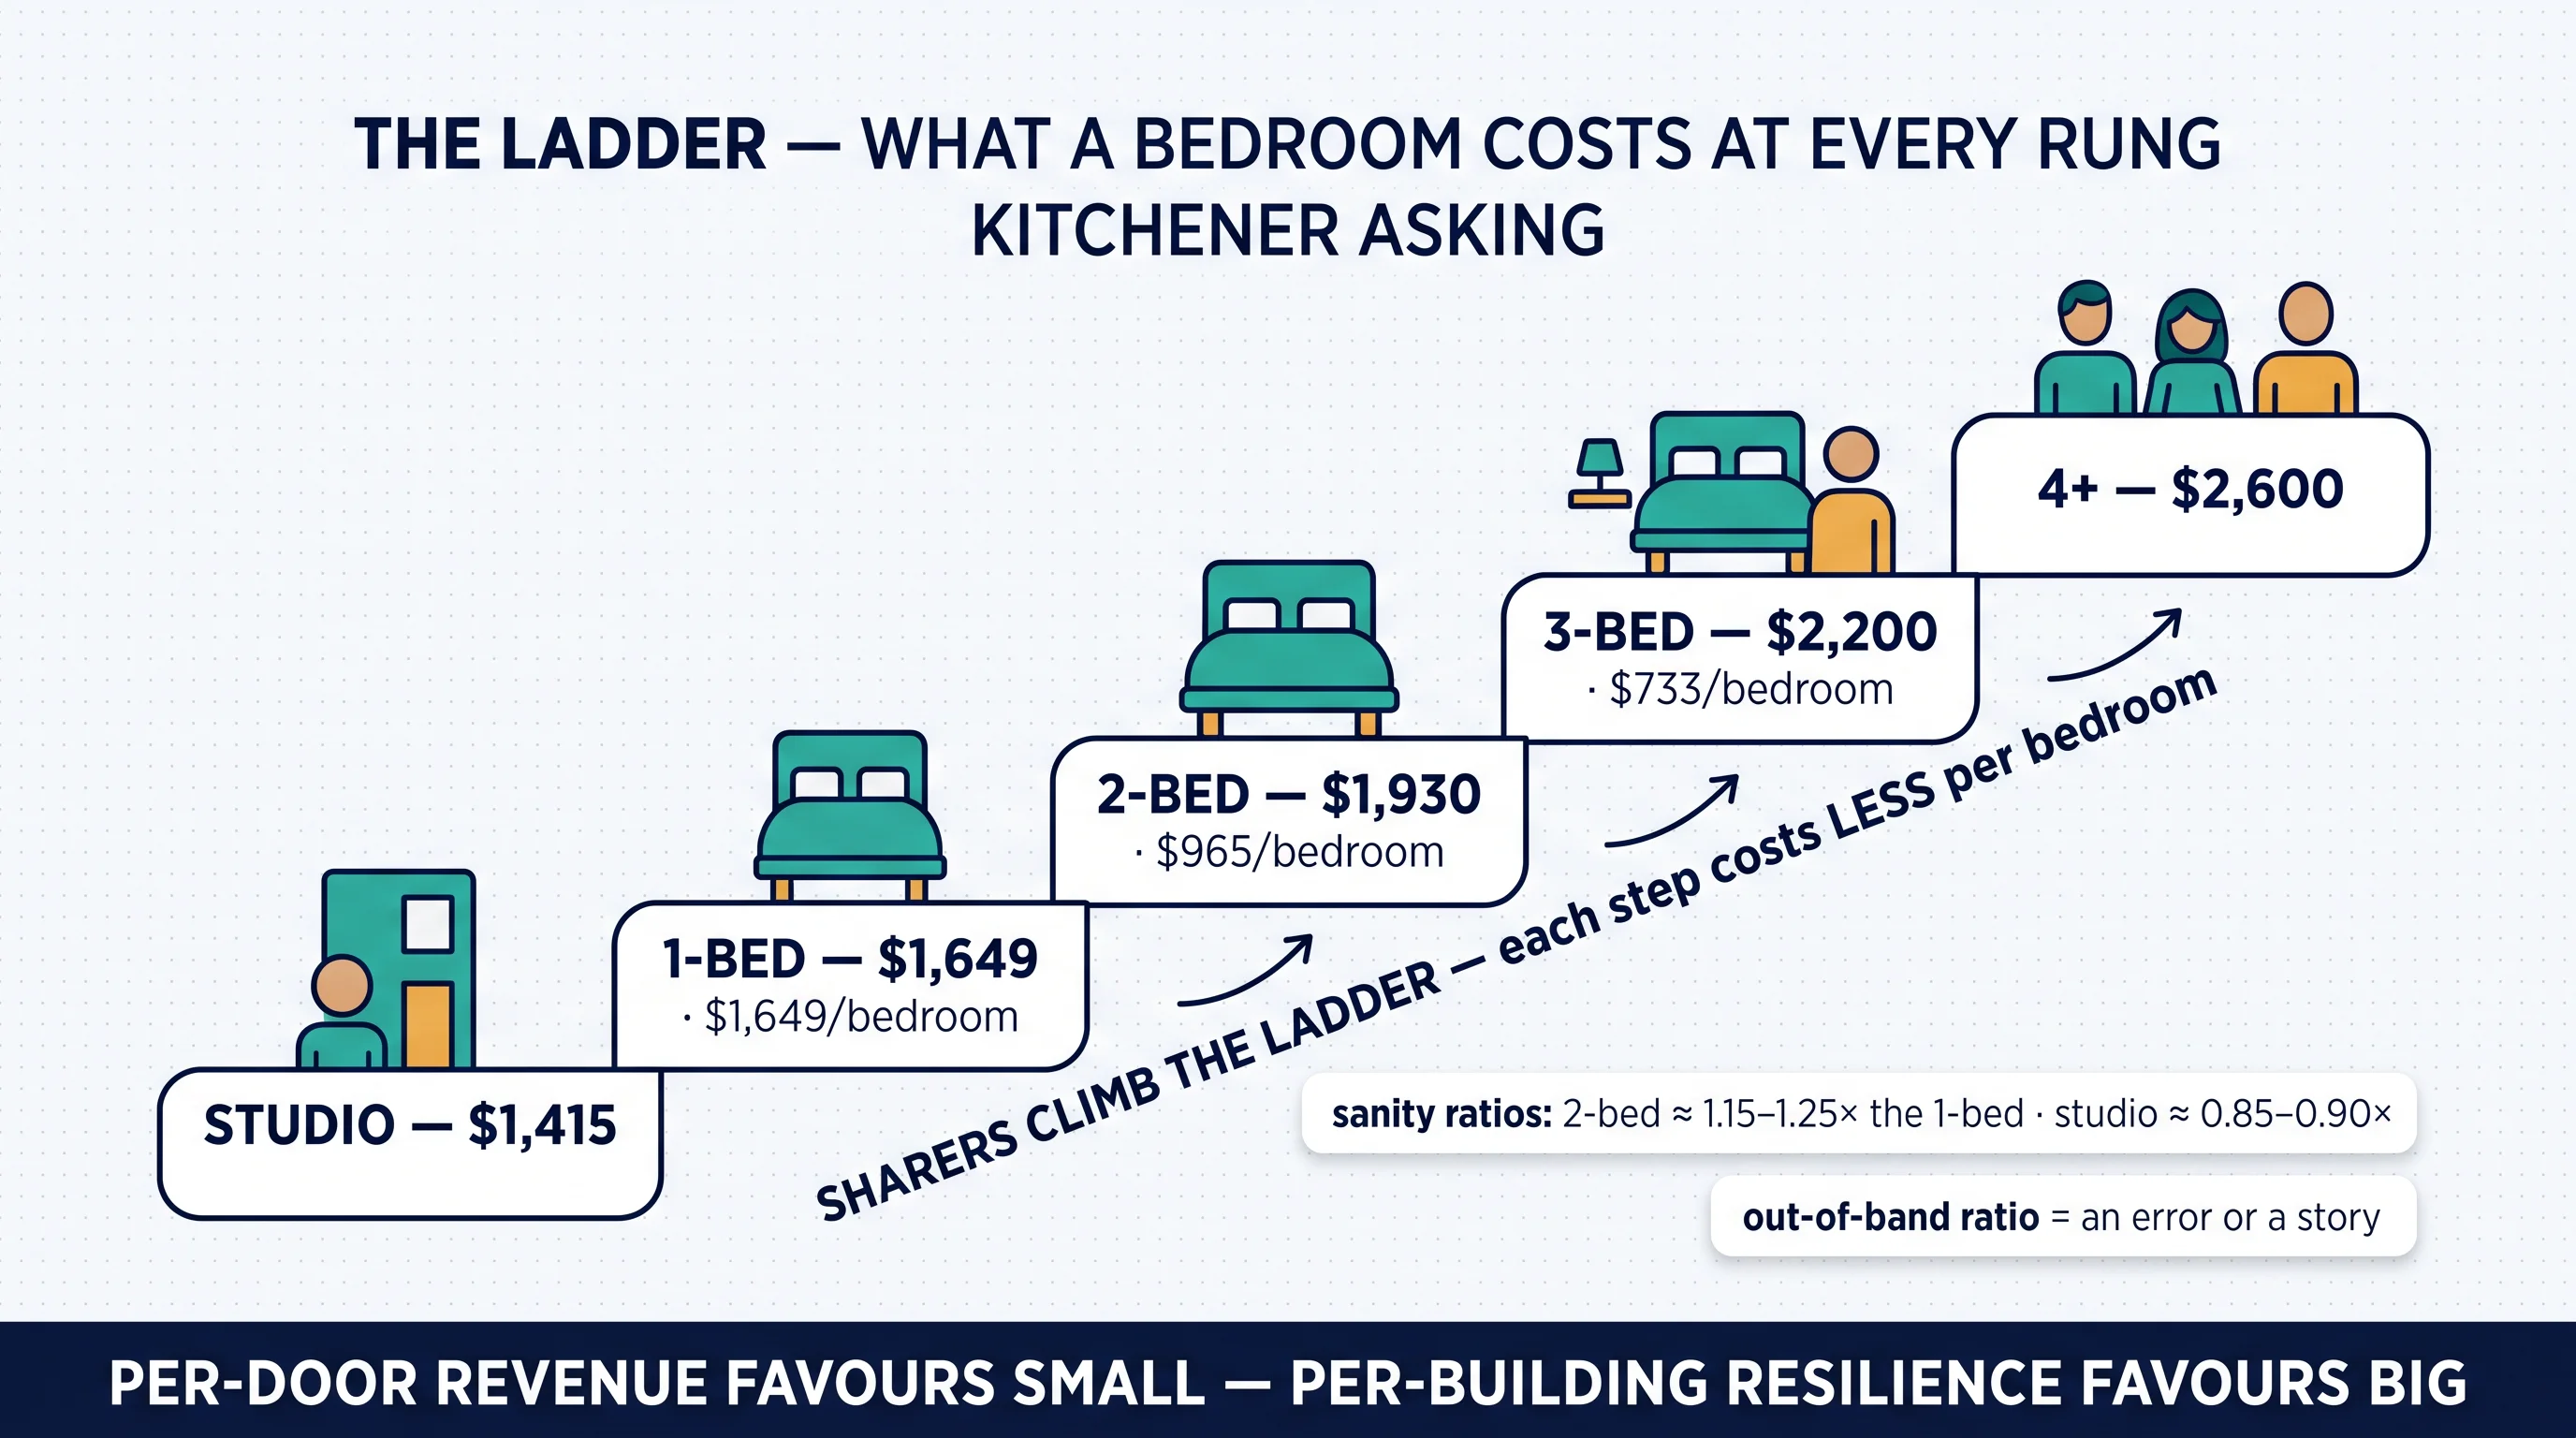
The ladder also hands you a free error-detector: the ratios. Across verified prints, a city's two-bed typically asks 1.15–1.25× its one-bed (Kitchener sits at 1.17×; the national figures imply 1.24×), studios run 0.85–0.90× the one-bed, and three-beds 1.30–1.45× where printed. When a figure breaks the band, it's either an error or a story — student concentrations compress per-bedroom pricing near campuses; family-unit scarcity stretches the three-bed premium. And the honest landlord read on the whole ladder: per-door revenue favours small units (more doors per building, faster turns to a deep pool) while per-building resilience favours big ones (an undersupplied tenant pool, longer tenancies, and fewer of the expensive turns our turnover guide prices out). Neither is "better" — they're different businesses, sometimes in the same building, and the comparison discipline belongs in the same sheet as the yield math from our first-rental and scaling guides.
The 2026 Inversion — and the Refresh Contract
Here's the year's story, told through the matrix. Supply built small: the record construction wave delivered disproportionately studios and one-bedrooms — and those are exactly the segments correcting hardest, with one-beds falling faster than two-beds nationally (−3.3% vs −2.4%) and Ontario's corrections ranked Hamilton −9.6%, Kitchener −7.7%, Toronto −7.1%, Oshawa −5.6%, Ottawa −4.5%, London −2.4%. Demand climbed big: CMHC's mid-year analysis projects affordability pressure pushing tenants into shared living, "further boosting demand for 3+ bedroom apartments" while smaller units struggle to attract tenants — in a segment its own deputy chief economist already called "rare and expensive." The result: vacancy risk and pricing power now split by floor plan. Small-unit owners are fighting the supply wave with incentives and speed-to-lease; multi-bed owners are holding structural scarcity and should be playing retention.
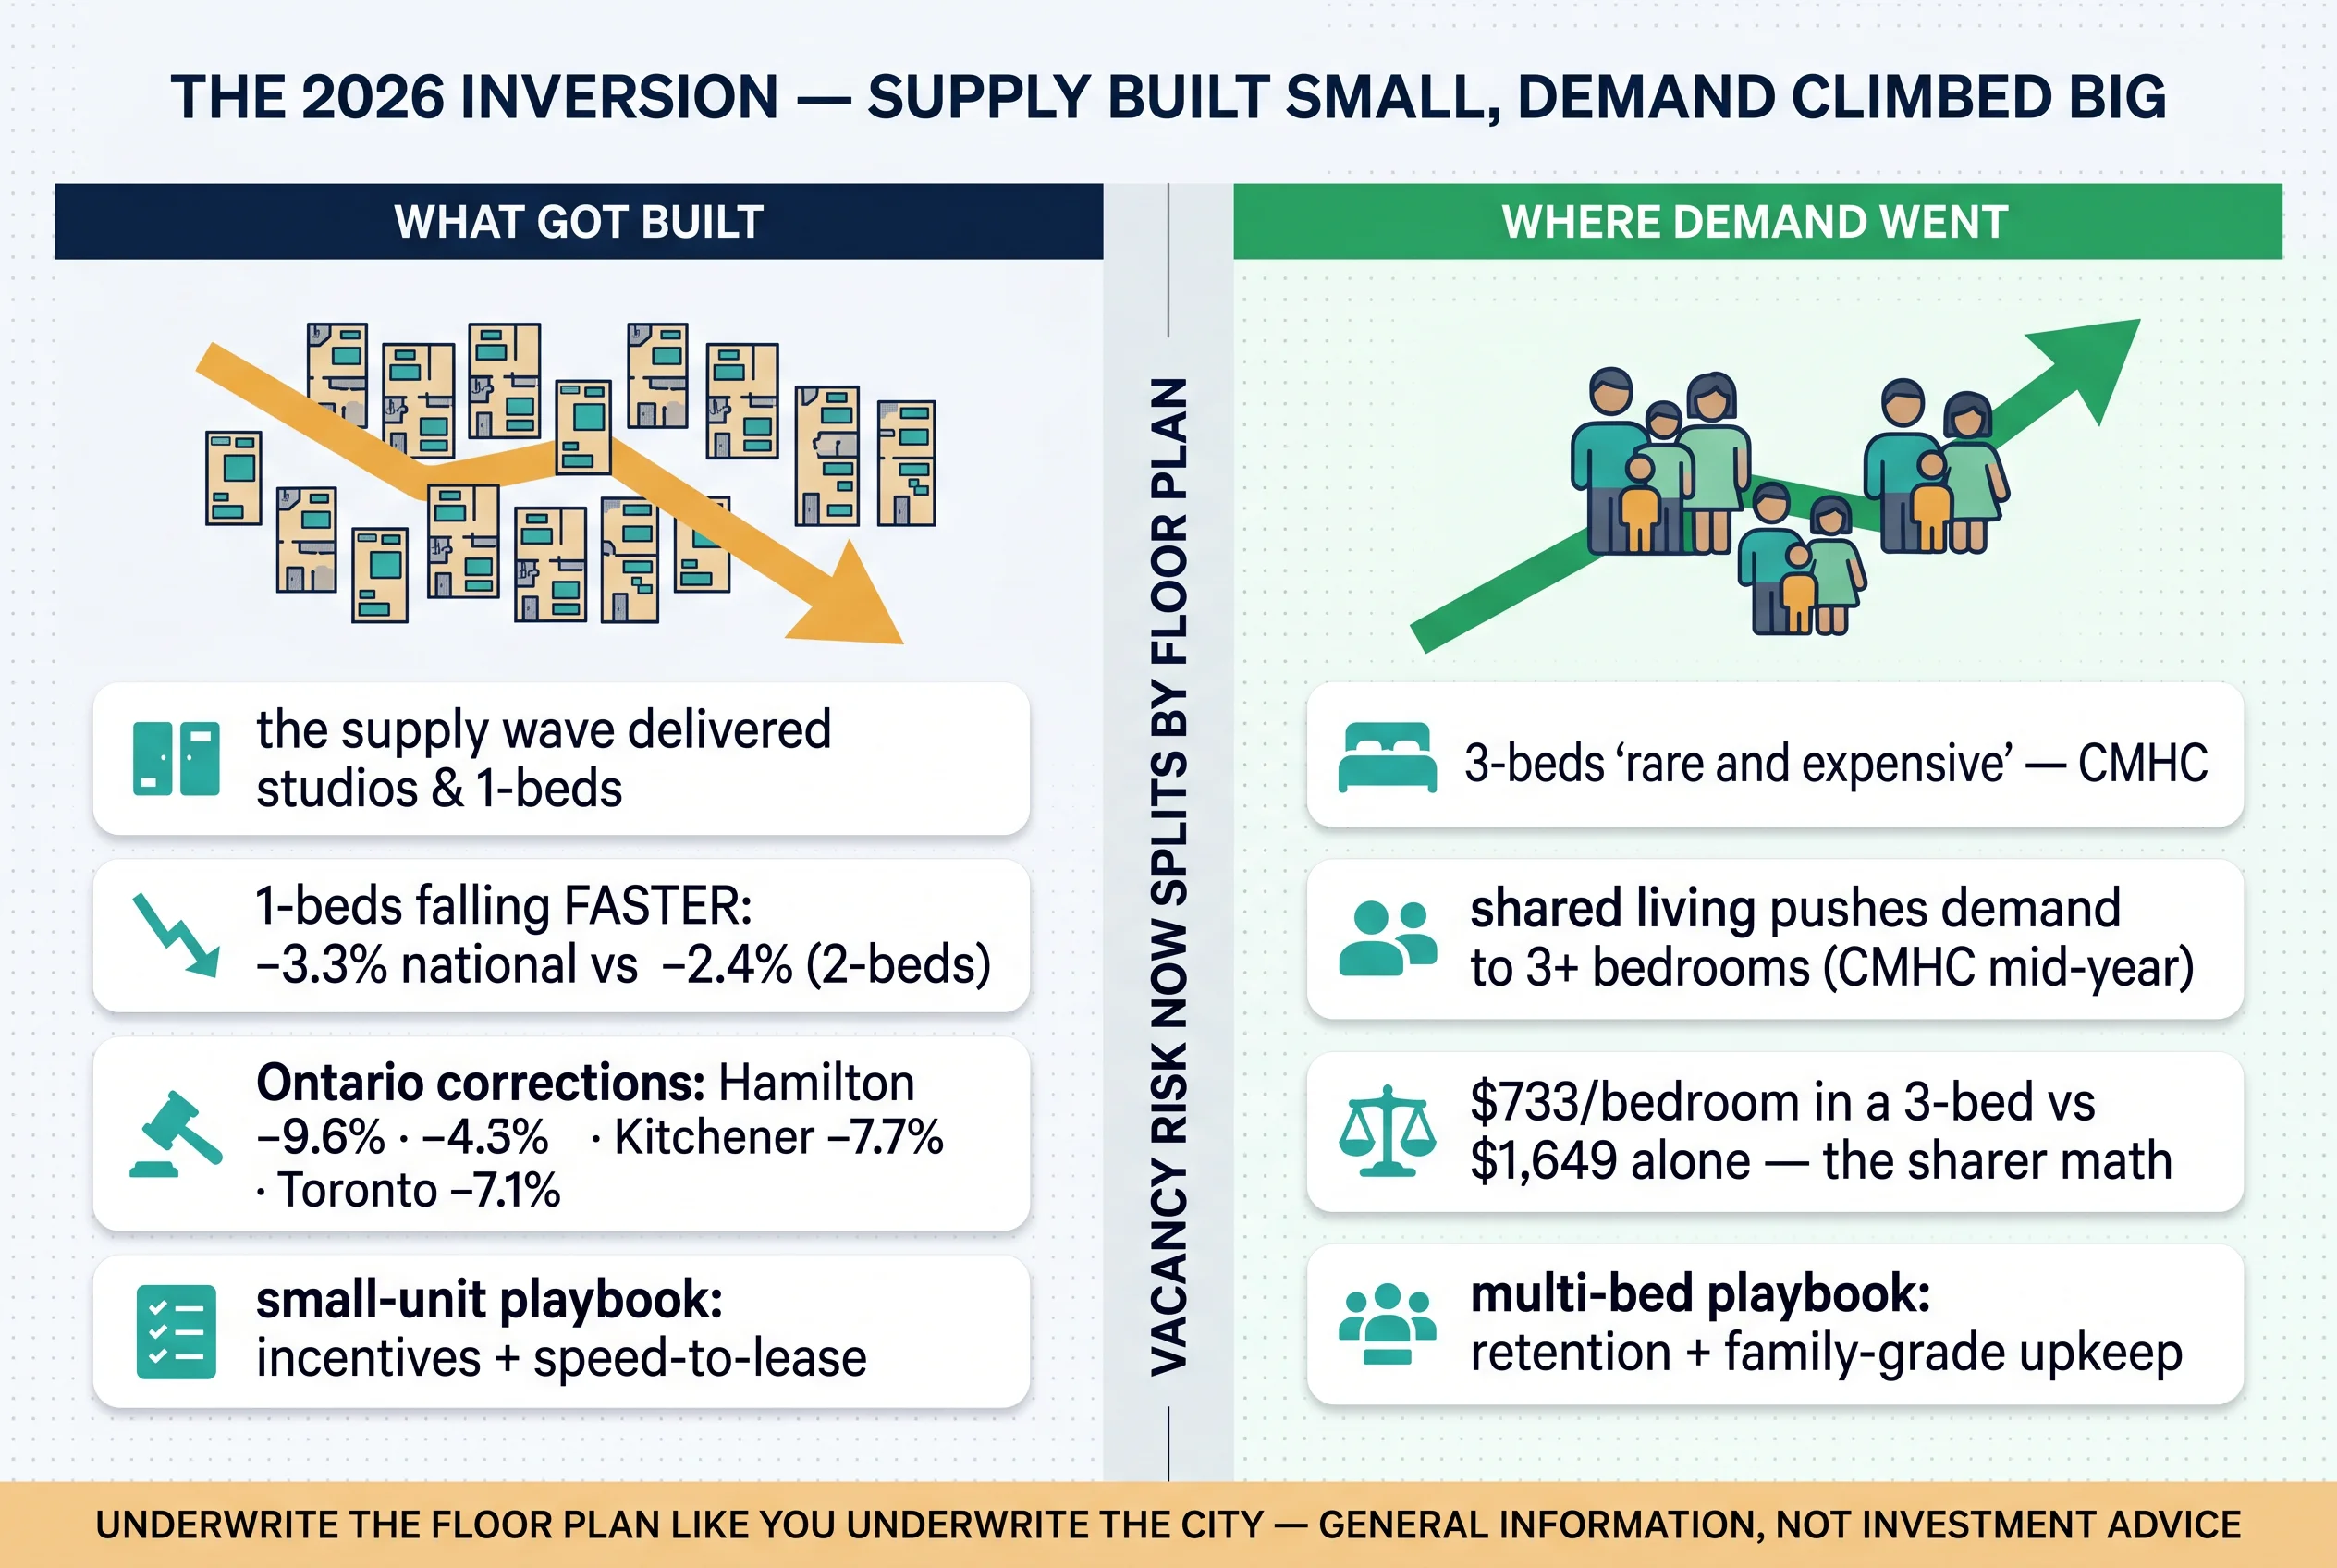
Two composites show the stakes. The mix-shift mirage: a Toronto owner reads a listing page's "+4.35%" and serves an ambitious renewal number; the tenant, reading the report's "−7.1%," declines and re-rents nearby for less — and the unit sits through the incentive season. The instrument, not the market, wrote that vacancy. The holdout premium: an Ottawa landlord absorbs the provincial headline — "rents falling everywhere" — and prices defensively, leaving money on the table in the one big Ontario market printing +1%. Both errors have the same cure: three labels and a date on every number, and renewal strategy run off your unit's actual position — the mechanics live in our lease renewal guide.
The refresh contract, printed: this page refreshes quarterly — next in October 2026, then December 2026 after the new CMHC Rental Market Survey publishes — and every figure above carries its vintage. Between refreshes, the sources are named for self-service: CMHC's housing-market portal (with its reliability codes), StatCan's quarterly asking-rent tables, and the monthly platform research reports — the report, not the page. Keep the resulting decisions provable in the systems built for it: the collection ledger, the software that keeps it, and the insurance line that belongs in every unit's math.
Practical Takeaways
- Never quote or accept a rent figure without its three labels — bedroom count, city (and pocket), series — plus a date.
- Price vacant units off bedroom-matched asking comps from a report (not a page), with incentives netted out.
- Sanity-check every figure against the ladder ratios — an out-of-band number is either an error or a story; find out which.
- Run the per-bedroom math before comparing floor plans — $/bed is the tenant's view and the sharer economy's engine.
- Know your floor plan's 2026 position: small units play supply-wave defence (incentives, speed); multi-beds play scarcity offence (retention, family-grade maintenance).
- Budget growth off the rules — 2.1%/1.9% on controlled stock via N1, market repricing at turnover — never off either headline series.
- Re-pull the sources quarterly and before every pricing decision.
Quick win tonight: label every rent number in your current pro forma with its three variables — the unlabelled ones are the risks. Long-term: keep a bedroom-matched comp file per building; the download below gives you the matrix and the pricing worksheet to keep it in.
The Ontario Bedroom Rent Matrix: Every City, Every Unit Size, Both Series (XLSX)
The bedroom matrix as a working spreadsheet — studio through 3-bed rents for every major Ontario city in both data series, plus a formula-live unit-pricing worksheet that turns bedroom-matched comps into a defensible list price.
Get Free PDF →Three Labels, One Matrix
There is no "average rent" — there's a matrix, and now it's maintained: bedroom by bedroom, city by city, both series, every cell dated and reliability-flagged. The 2026 story runs through it in one direction — the supply wave built small while demand climbed big, the asking series corrected while the occupied series rose — and the only landlords mispriced by any of it were the ones reading one number where three labels belonged. This page exists to be cited and re-cited: the matrix refreshes quarterly, the sources are named, and the codes travel with the cells. Use it as the pricing language; then walk the comp, match the bedroom, and let the specific unit's numbers finish the sentence. General information, not investment advice — the professionals check the math, and you own the decision.
The Rent That Matters Is the One Collected and Documented
The Ontario Standard Lease, the N1 and N2 done right, the rent-increase calculator, and collection rails that build your ledger automatically — free on Tenon10, whatever your floor plan.
Free • No signup required • Updated for the Bill 60 changes in force 21 Sep 2026
Related Resources
The data siblings: the cap-rate and rent data page (the yield language) · the Best Ontario Cities scorecard (the strategy frame) · the Toronto neighbourhoods map (the block-level version) · the property-tax comparison page joins this set later in the sprint.
Pricing and increases: Rent Increases 2026 (N1 Guide) · Rent Increases 2027 · Lease Renewal Strategies · Ontario Rental Law Changes 2026.
The operating layer: Tenant Turnover: Reducing Vacancy Days · Rent Collection at Scale · Property Management Software · CRA Audits of Rental Income · Landlord Insurance.
Buying and scaling: Becoming a Landlord in Ontario · Buying Your First Rental Property · How to Scale a Rental Portfolio.
Forms and tools: the Ontario LTB forms hub · Standard Lease · N1 and N2 · the rent increase calculator and termination date calculator.
Frequently Asked Questions
What is the average rent in Ontario in 2026?
As a single number, roughly $2,050 for a one-bedroom and $2,500 for a two-bedroom on the asking side (mid-2026, province-wide averages pulled up by the GTA) — but the honest answer is that "average rent" needs three labels before it means anything: bedroom count, city, and data series. The same month those provincial figures printed, a Toronto one-bed asked ~$2,480 while a Kitchener one-bed asked $1,649; Hamilton's "average" printed anywhere from $1,601 to $2,075 across four platforms; and CMHC's occupied-stock series (what sitting tenants pay) showed Toronto two-beds at ~$2,046 against askings of $2,797+. Asking rents were also falling in most Ontario cities (Hamilton one-beds −9.6% year-over-year, Kitchener −7.7%, Toronto −7.1%) while Ottawa printed +1% and occupied rents edged up on turnover repricing. Use the bedroom-and-city matrix on this page, check the series label on every figure, and treat any unlabelled "average rent" as a different number wearing the same name.
Why do rent websites show different average rents for the same city?
Because they're different instruments measuring different slices, sometimes even within one company. A platform's city listing page is typically a rolling 30-day median of everything listed — so a month heavy in luxury listings reads as "rents rising" even while like-for-like rents fall (Zumper's Toronto page printed +4.35% the same period its own research report printed −7.1% on one-bedrooms; both were methodologically correct). Research reports curate bedroom-specific medians; Zillow and Apartments.com sample different inventory mixes; small markets produce thin-sample swings (a +21% print in one 905 city was noise, not a boom). CMHC's series differs again — it measures what sitting tenants actually pay across purpose-built stock, updated annually, with per-cell reliability codes from "a" (excellent) to "d" (use with caution) and ** where data is suppressed. None of this makes the numbers useless; it makes labels mandatory. Read the methodology line before the number, prefer reports over pages, bedroom-match every comp, and carry the date.
Are bigger units better rental investments than small ones?
They're different businesses, and 2026 sharpened the difference. Per door, small units generate more rent per square foot and per bedroom ($1,649 for a Kitchener one-bed versus $733 per bedroom in a three-bed) and turn over faster to a deep tenant pool — but that's exactly the segment the construction wave oversupplied, which is why one-bedroom asking rents are falling fastest (−3.3% nationally versus −2.4% for two-beds, and −7% to −10% in Ontario's correcting cities). Per building, multi-bedroom units offer structural scarcity — CMHC's own economists call three-bedroom rentals "rare and expensive," and its mid-year analysis projects shared-living demand pushing tenants toward 3+ bedroom units while smaller units struggle to attract them — plus longer tenancies and lower turnover costs. The per-bedroom discount that makes big units cheaper for tenant groups is precisely what makes them resilient for owners. Neither wins universally: underwrite the floor plan the way you underwrite the city, and match it to the block's tenant base. General information, not investment advice.
Should I use CMHC rents or asking rents to price my unit?
Both — for different jobs. To price a vacant unit today, use bedroom-matched asking comps from the last 30–60 days (from research reports rather than listing pages, with incentives like free months netted out), because that's the market your listing competes in — and in most 2026 Ontario cities that market is below last year's screenshots. To understand your building's reality and the market's depth, use CMHC's occupied-stock tables — they cover sitting tenants (most of the market), publish to neighbourhood grain, and carry reliability codes that tell you how much to trust each cell. To budget growth, use neither headline: on units first occupied on or before November 15, 2018, increases are capped at the guideline — 2.1% for 2026 and 1.9% for 2027, served on an N1 — while later-occupied units are exempt (N2) but still bound by the 90-day notice and 12-month rules, and by market comps that bind harder than either in a falling-asking year. The pattern that breaks pro formas is mixing the series without labels; the pattern that works is one job per series.
Why are 3-bedroom rentals so expensive and hard to find in Ontario?
Because almost nobody built them. Decades of condo and purpose-built construction optimized for studios, one-beds, and two-beds — the unit sizes that pencil for developers — leaving three-bedroom rentals what CMHC's deputy chief economist calls "rare and expensive": Toronto three-bed askings printed around $3,638 and Ottawa around $2,741 as far back as May 2024, and the scarcity has only tightened as families compete with a newer demand source — sharers. CMHC's 2025 mid-year analysis projects affordability pressure pushing more tenants into shared living, "further boosting demand for 3+ bedroom apartments" while smaller units struggle — the bedroom-mix inversion running through 2026's market. The per-bedroom math explains the sharer side: a three-bed at $2,200 costs $733 per bedroom against $1,649 for a one-bedroom alone. For landlords who own or can create family-sized units (including via Ontario's growing suite and multiplex permissions), the scarcity is a structural tailwind; for tenants, it's why the big-unit hunt is the hardest search in the market. Figures dated as shown — verify current prints before deciding anything.
This data page provides general information about Ontario rental markets as of July 13, 2026 and is not investment, legal, financial, or tax advice. Rent figures are attributed to their sources (CMHC, Statistics Canada, and named platform reports), carry the vintages shown, and change continuously — this page refreshes quarterly, and all figures should be verified at source before any pricing, leasing, purchasing, or financing decision. Consult a licensed real estate professional, mortgage broker, lawyer, and accountant about your specific situation.


