

Ontario publishes a days-on-market figure for every house that sells. For the units people actually rent, it publishes nothing at all. Search for how long it takes to lease a unit in this province and you will find plenty of confident answers — two weeks, a month, "it depends" — but not one of them traces back to a published statistic, because no such statistic exists.
That gap costs money. Landlords price against a number nobody has given them. Property managers forecast turnover on instinct. Tenants staring at a listing that has been up for three weeks cannot tell whether it is overpriced, quietly flawed, or simply one of dozens in a building that all went live the same Tuesday. Everybody in the transaction is working from a guess, and the guess almost always runs in the expensive direction.
This guide does something different. It derives a defensible benchmark from the supply data that is published, then breaks that single number into the four segment ranges that actually apply to real units. You will get a day-by-day diagnostic for reading your own listing's clock, the arithmetic that decides whether holding out for more rent is worth the vacancy, and an honest account of where each figure comes from. All figures are current as of August 2026 and carry their source and month.
Here is the route: why the number does not exist, the closest real proxy to it, which market you are actually in, how the cities differ, what genuinely moves the clock, how to read your own listing, the maths, and what the rest of 2026 looks like.
The Ontario Renter's Timing Checklist: 18 Steps to a Better Deal
Most renters can't tell whether a listing has been sitting for a reason — or whether they're the one with leverage. This free checklist shows you how to read a listing's clock, time your search to the Ontario market, and know exactly what a landlord can and cannot lawfully ask you for.
Get Free PDF →The short answer
For a well-priced, well-presented unit in most of Ontario, expect two to four weeks from the day the listing goes live to a signed lease. For a new-build studio near a university campus, expect weeks to months. The spread between those two outcomes is wider than the average, and it is the more useful fact.
That range is not a survey result. It is derived, and the derivation is worth understanding before you rely on it — because knowing how a number was built tells you when it stops applying to you.
Why nobody can give you the number
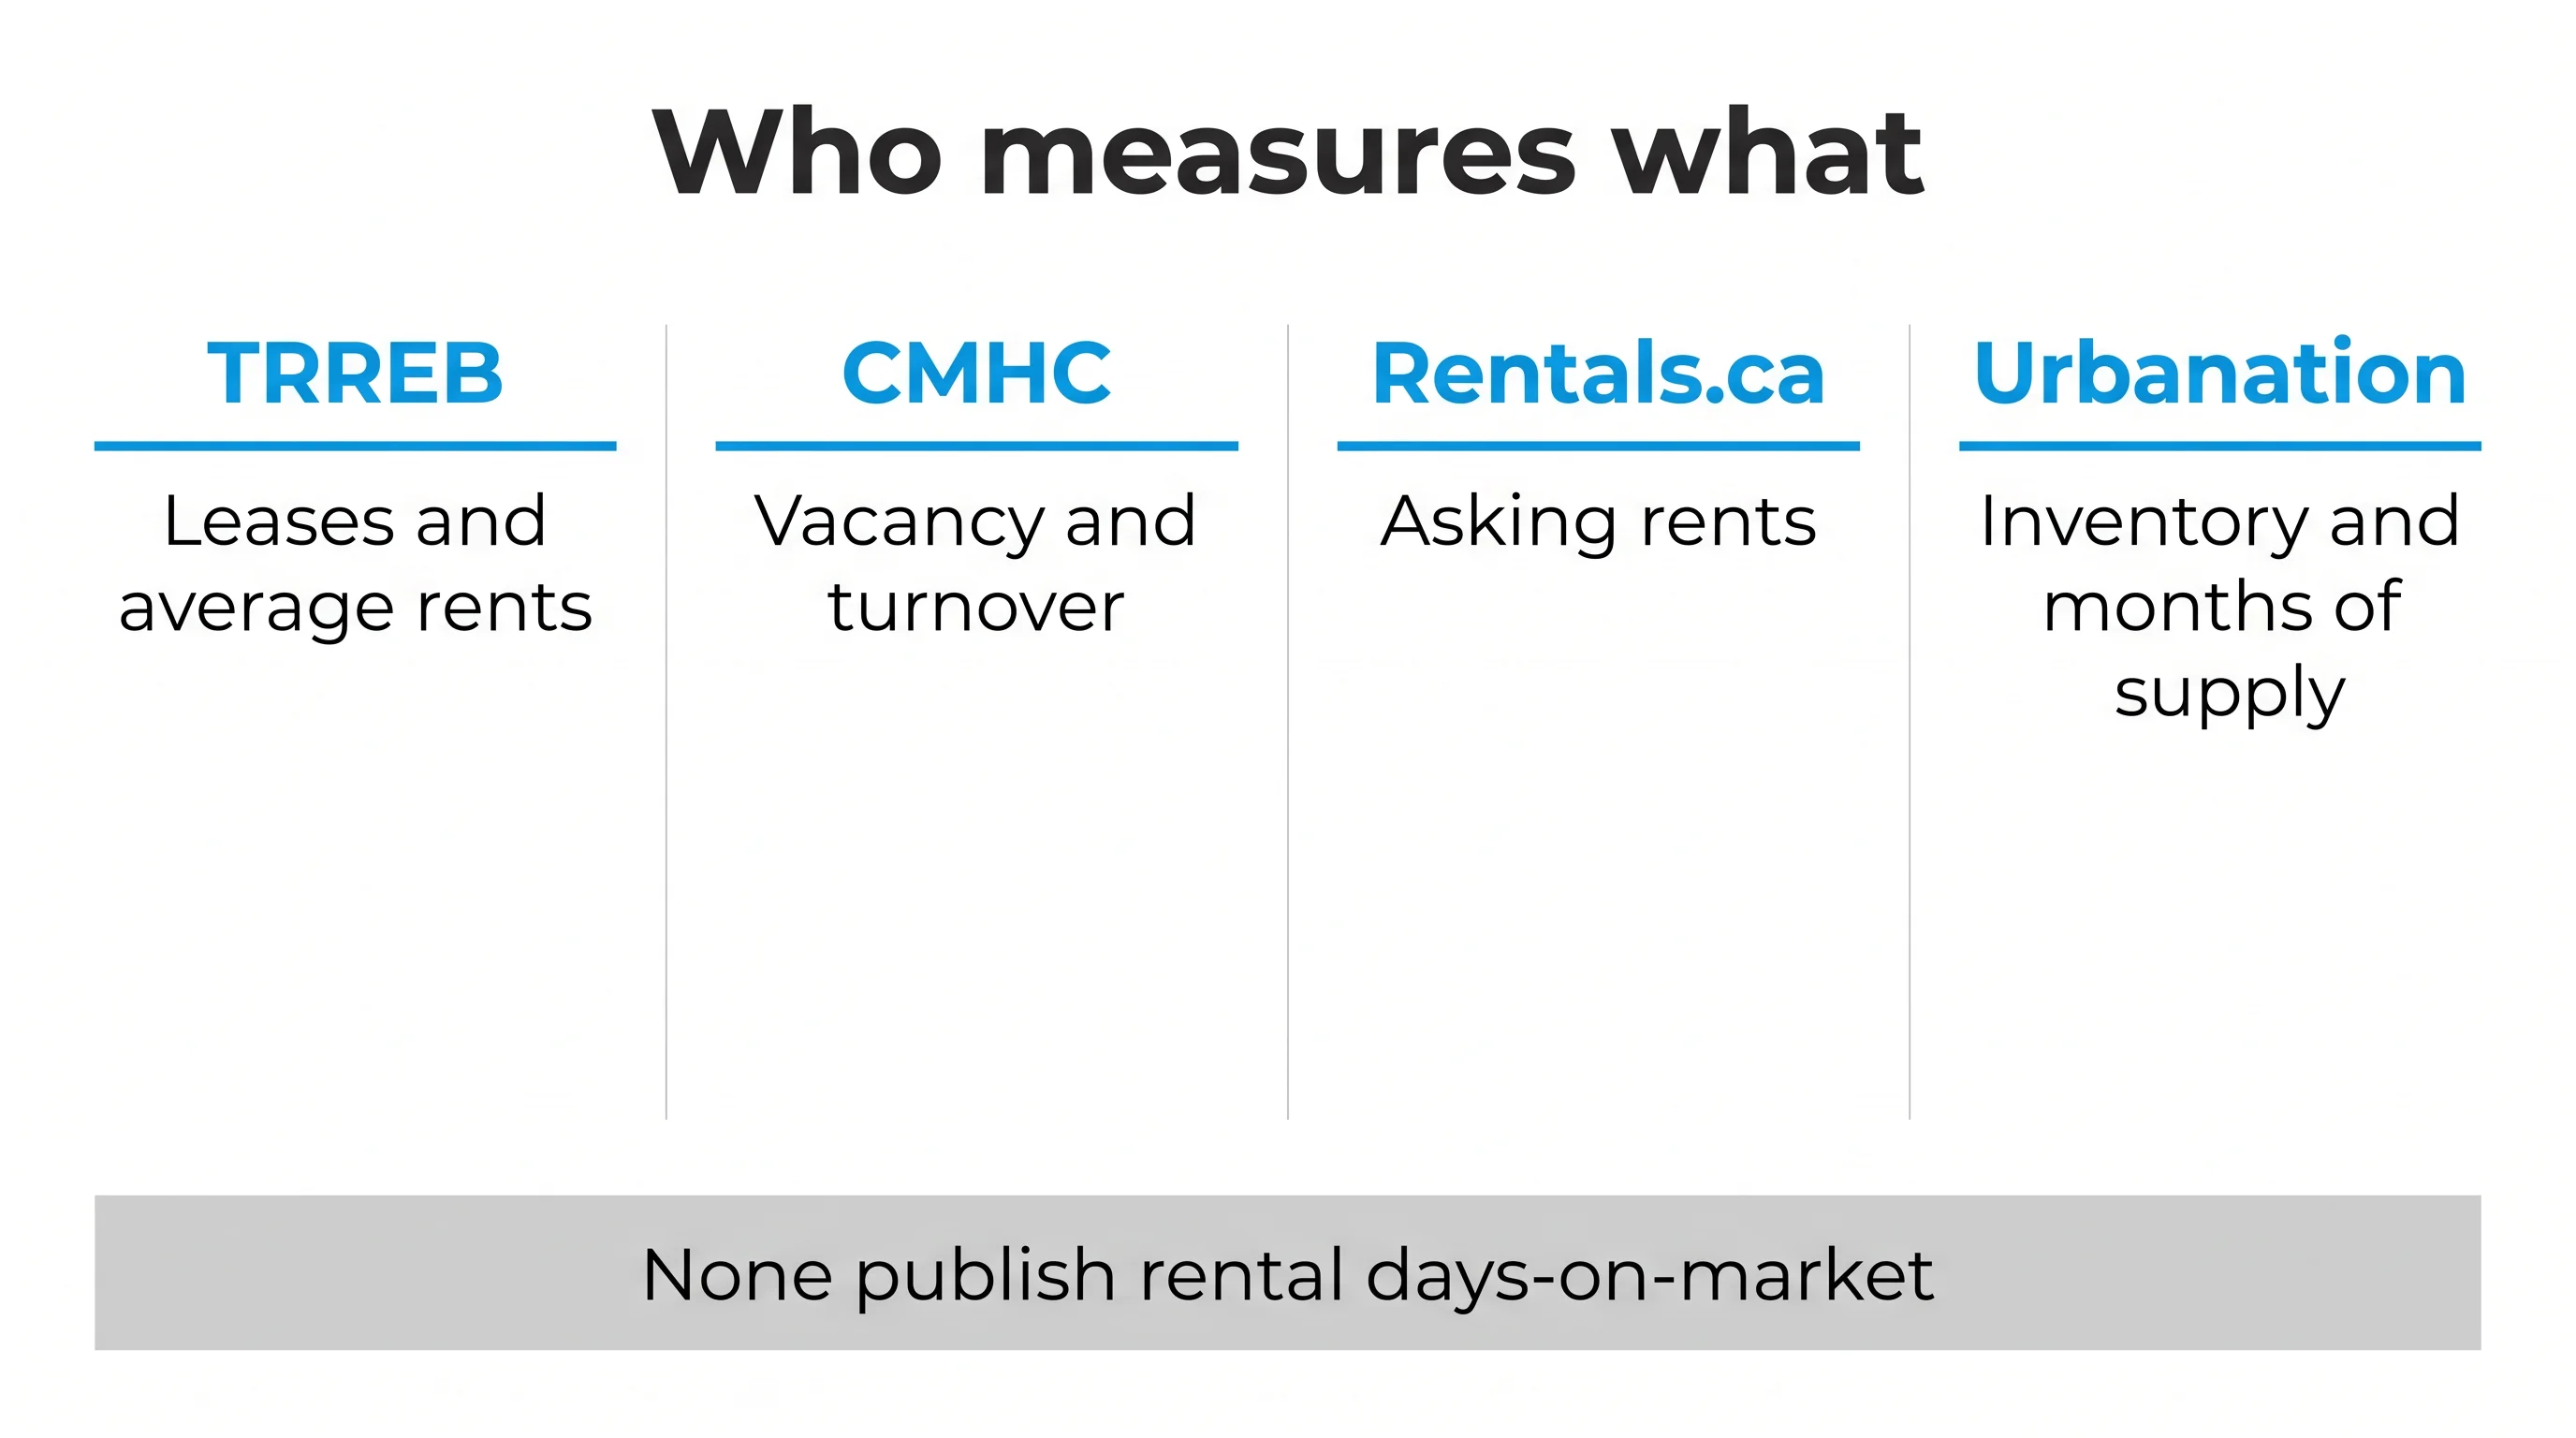
Four organisations publish rental market data for Ontario. None of them publishes days-on-market for leases.
Before going further, five terms worth pinning down, because they get used interchangeably and they do not mean the same thing:
- Days on market (DOM) — the number of days from a listing going live to a firm agreement. Published for resale housing. Not published for leases.
- Vacancy rate — the share of units physically empty and available at the moment of the survey. A snapshot, not a duration. A 3% vacancy rate tells you nothing about how long any individual unit sat.
- Availability rate — vacant units plus occupied units where the tenant has already given notice. A leading indicator of what is about to hit the market.
- Months of supply — active listings divided by the monthly pace of leases. The one metric in the set that converts directly into time.
- Turnover rate — the share of units that changed tenant in the past twelve months.
Here is who measures what. The Toronto Regional Real Estate Board publishes a quarterly Rental Market Report covering lease transactions, listings and average rents by bedroom count — and publishes days-on-market for sales only. CMHC runs its Rental Market Survey each October, published in December, plus mid-year updates; it measures vacancy, turnover, and average rent paid across the entire stock. Rentals.ca and Urbanation produce a monthly National Rent Report tracking asking rents on available units. Urbanation separately surveys the Greater Toronto and Hamilton Area and Ottawa quarterly for inventory, absorption, incentives and months of supply.
One caution before any of these numbers get used, and it matters more than it sounds: these datasets are not interchangeable. Rentals.ca measures asking rents on units currently available. CMHC measures rents actually being paid across the whole stock, including long-tenured tenancies where a rent-controlled tenant has been in place for a decade. Urbanation surveys buildings completed since 2000. Blending them produces a figure that describes no real market and no real unit.
So when a leasing agent tells you a unit takes three weeks, they are not being dishonest. They are reporting the only thing available: their own recollection of their own listings. Understanding that is what makes the next section worth reading rather than simply believing.
The closest thing to a real figure: months of supply
Months of supply is the bridge between inventory and time, and Urbanation publishes it quarterly for the GTHA condo rental market — the largest single rental pool in the province.

The derivation runs in three steps, and you can check the work.
- Active listings. There were 5,366 active condo rental listings across the GTHA at the end of Q2 2026 — down 13% year over year, the largest annual decrease in four years.
- Months of supply. Against a record 18,923 condo leases signed in the quarter, that inventory works out to 0.9 months of supply, down from 1.2 months in Q2 2025 and below the long-term average of 1.0 month.
- Convert to days. At 0.9 months, available inventory clears in roughly 27 days. (Urbanation Q2-2026 Rental Market Report, July 27, 2026.)
Now the honest caveat. Months of supply describes how fast the market clears, not how long your unit will take. It is an average across a pool in which some units lease in three days and others sit for ninety. Treat 27 days as a benchmark to measure yourself against, not a promise anyone has made you.
What matters more than the level is the direction. Supply falling while lease volume rises means units are leasing faster than they were a year ago. First-half 2026 GTHA condo leases reached 34,150, up 11% and a third consecutive record first half. Meanwhile condo units under construction across the region fell to 38,252 in Q2 2026 — down 39% year over year and 64% below the Q2 2023 peak of 105,421. The supply wave that defined 2024 and 2025 is receding.
That matters because most rental advice still in circulation was written during that oversupply, when the answer really was "longer than you think." It no longer is, at least not in the core.
Urbanation president Shaun Hildebrand's read on the quarter was that "rents have likely found their floor", with room to rise as condo completions keep dropping and population growth recovers.
Which market are you actually in?
One average is not much use when the underlying pool ranges from three days to three months. Four segments explain most of that spread.
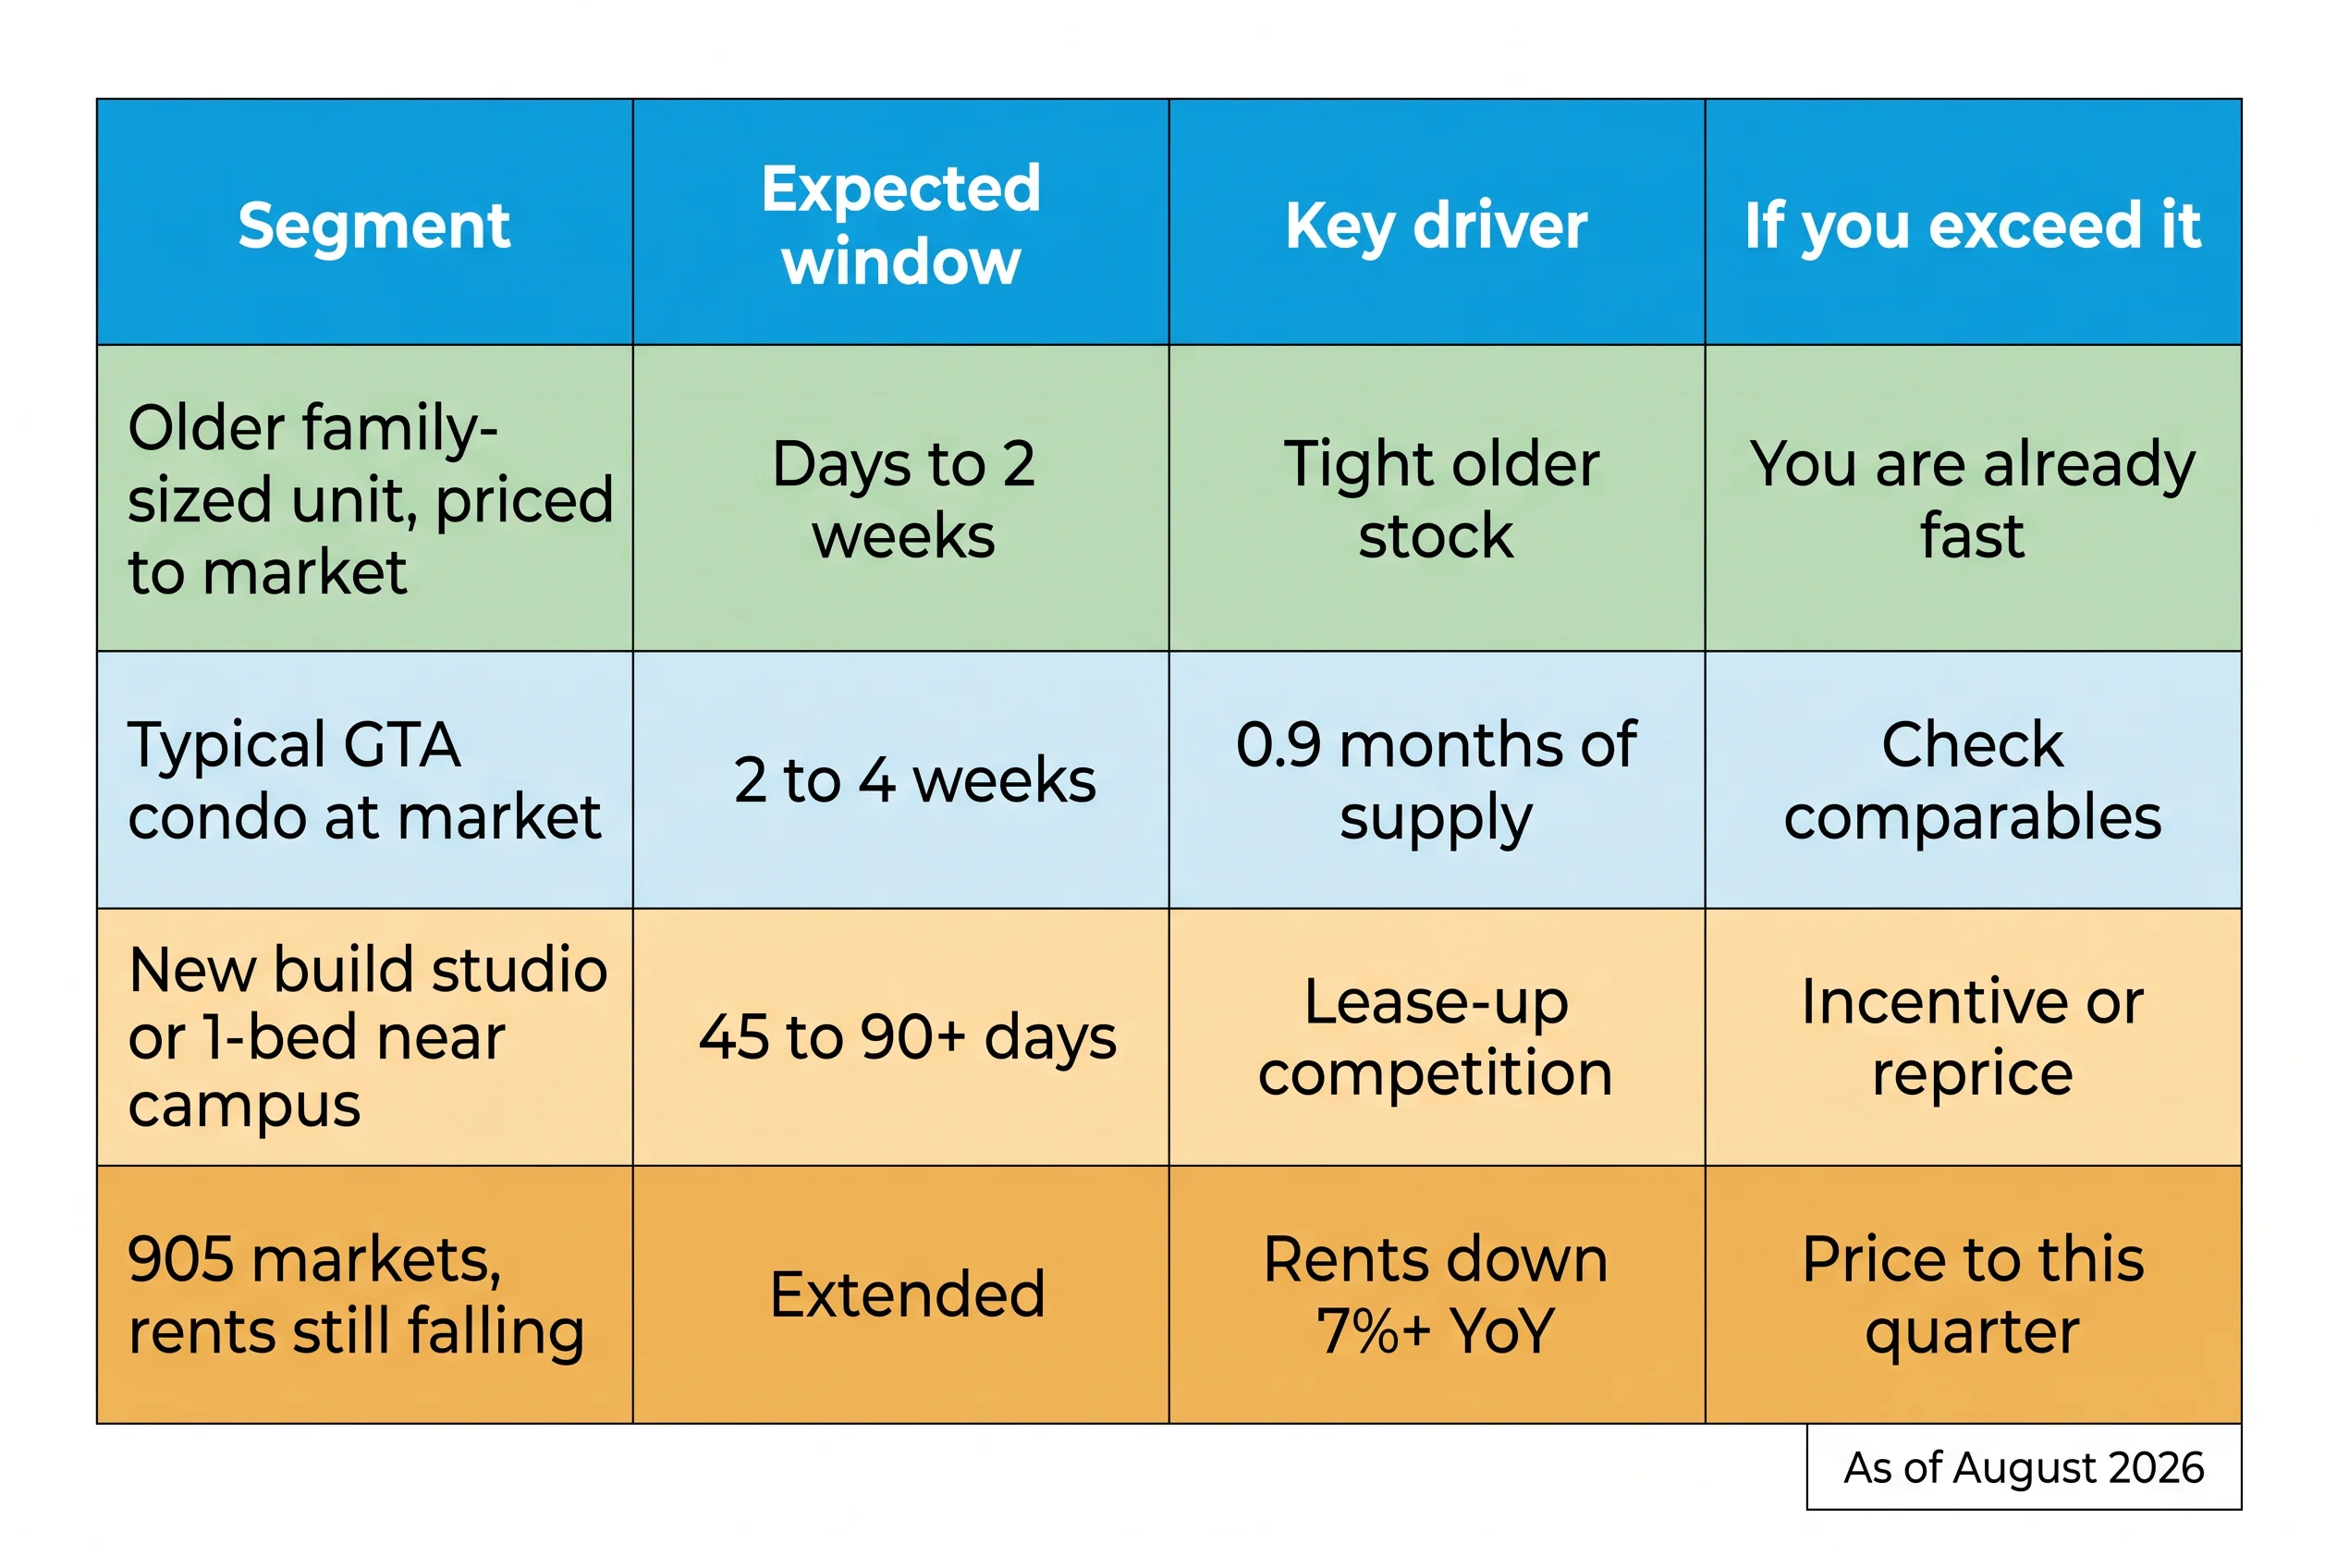
Older, family-sized, competitively priced: days to two weeks
CMHC's mid-year update found that older stabilized buildings and family-sized units continue to experience tighter conditions than the rest of the market. This is the fastest-moving segment in Ontario and the one where landlords most often underestimate their own position. One Hamilton operator managing over 600 units reports a median of 14 days on units priced within 3% of market and listed on day one of turnover — worth taking seriously as an operator's real experience, though it is one portfolio's figure and not a market statistic.
A typical GTA condo at market rent: two to four weeks
This is the base case, and it is consistent with 0.9 months of supply. If your unit is a mainstream condo priced against current comparables and photographed properly, this is the window you should be planning around.
New-build, studio or one-bedroom, campus-adjacent: months
CMHC found vacancies highest in structures built after 2020 and in units located near post-secondary institutions, with rental operators reporting that filling a new unit can take months. This is where nearly every "my unit won't rent" complaint originates — and the cause is the segment, not the market. A studio in a building that opened last year, three blocks from a campus, is competing against a different reality than a three-bedroom in a 1970s walk-up.
The 905 versus the 416 split
This is the most under-reported fact in Ontario rental coverage right now. In July 2026, Toronto apartment and condo asking rents rose 1.6% month over month to $2,577 and were down just 0.6% year over year, with listings down roughly 6%. Over exactly the same period, Brampton, Mississauga, Oakville and Oshawa all posted annual declines above 7%, and Markham was down 11.9%. (Rentals.ca / Urbanation August 2026 National Rent Report, August 6, 2026.) Same province, opposite conditions, thirty kilometres apart.
City by city
- Toronto — the tightest major market. Three-bedroom asking rents rose 3.9% annually to $3,655, and employment in the Toronto economic region was up 77,000 year over year.
- Ottawa — the softest of the majors. The availability rate in stabilized post-2000 buildings reached 6.5% in Q1 2026, the highest since the pandemic, with 57% of surveyed projects offering incentives and two months free at 39% of them — double the year-earlier share. Ottawa also recorded the largest year-over-year employment decrease in the province.
- Hamilton — comparatively tight, with vacancy at 3.6% in 2025 and CMHC expecting roughly 3.0% through 2026 and 2027. Demand comes from GTA migration, McMaster, and the hospital sector.
- Southwestern Ontario — the slowest. London carried a 9.1% unemployment rate, last among Canada's major labour markets, with Windsor, St. Catharines and Kitchener close behind.
What actually moves the clock
Five things account for most of the variance, and four of them are entirely within a landlord's control.
Anchoring to last year's rent
High-volume GTA leasing teams identify this as the single most common landlord error: pricing against peak comparables from a prior cycle rather than what is actually leasing this month. The fix is unglamorous — pull three live comparables in the same building or immediate area, dated this month, before you set a number. Not last spring's. Not what the unit down the hall got in 2023.
Listing on day fourteen instead of day one
Turnover work and listing preparation can run in parallel; most landlords run them in sequence. Every day between receiving notice and publishing the listing is a vacant day that never appears in anyone's days-on-market calculation, because the clock has not started yet. It is the cheapest fortnight you will ever recover.
Photography, especially in a lease-up building
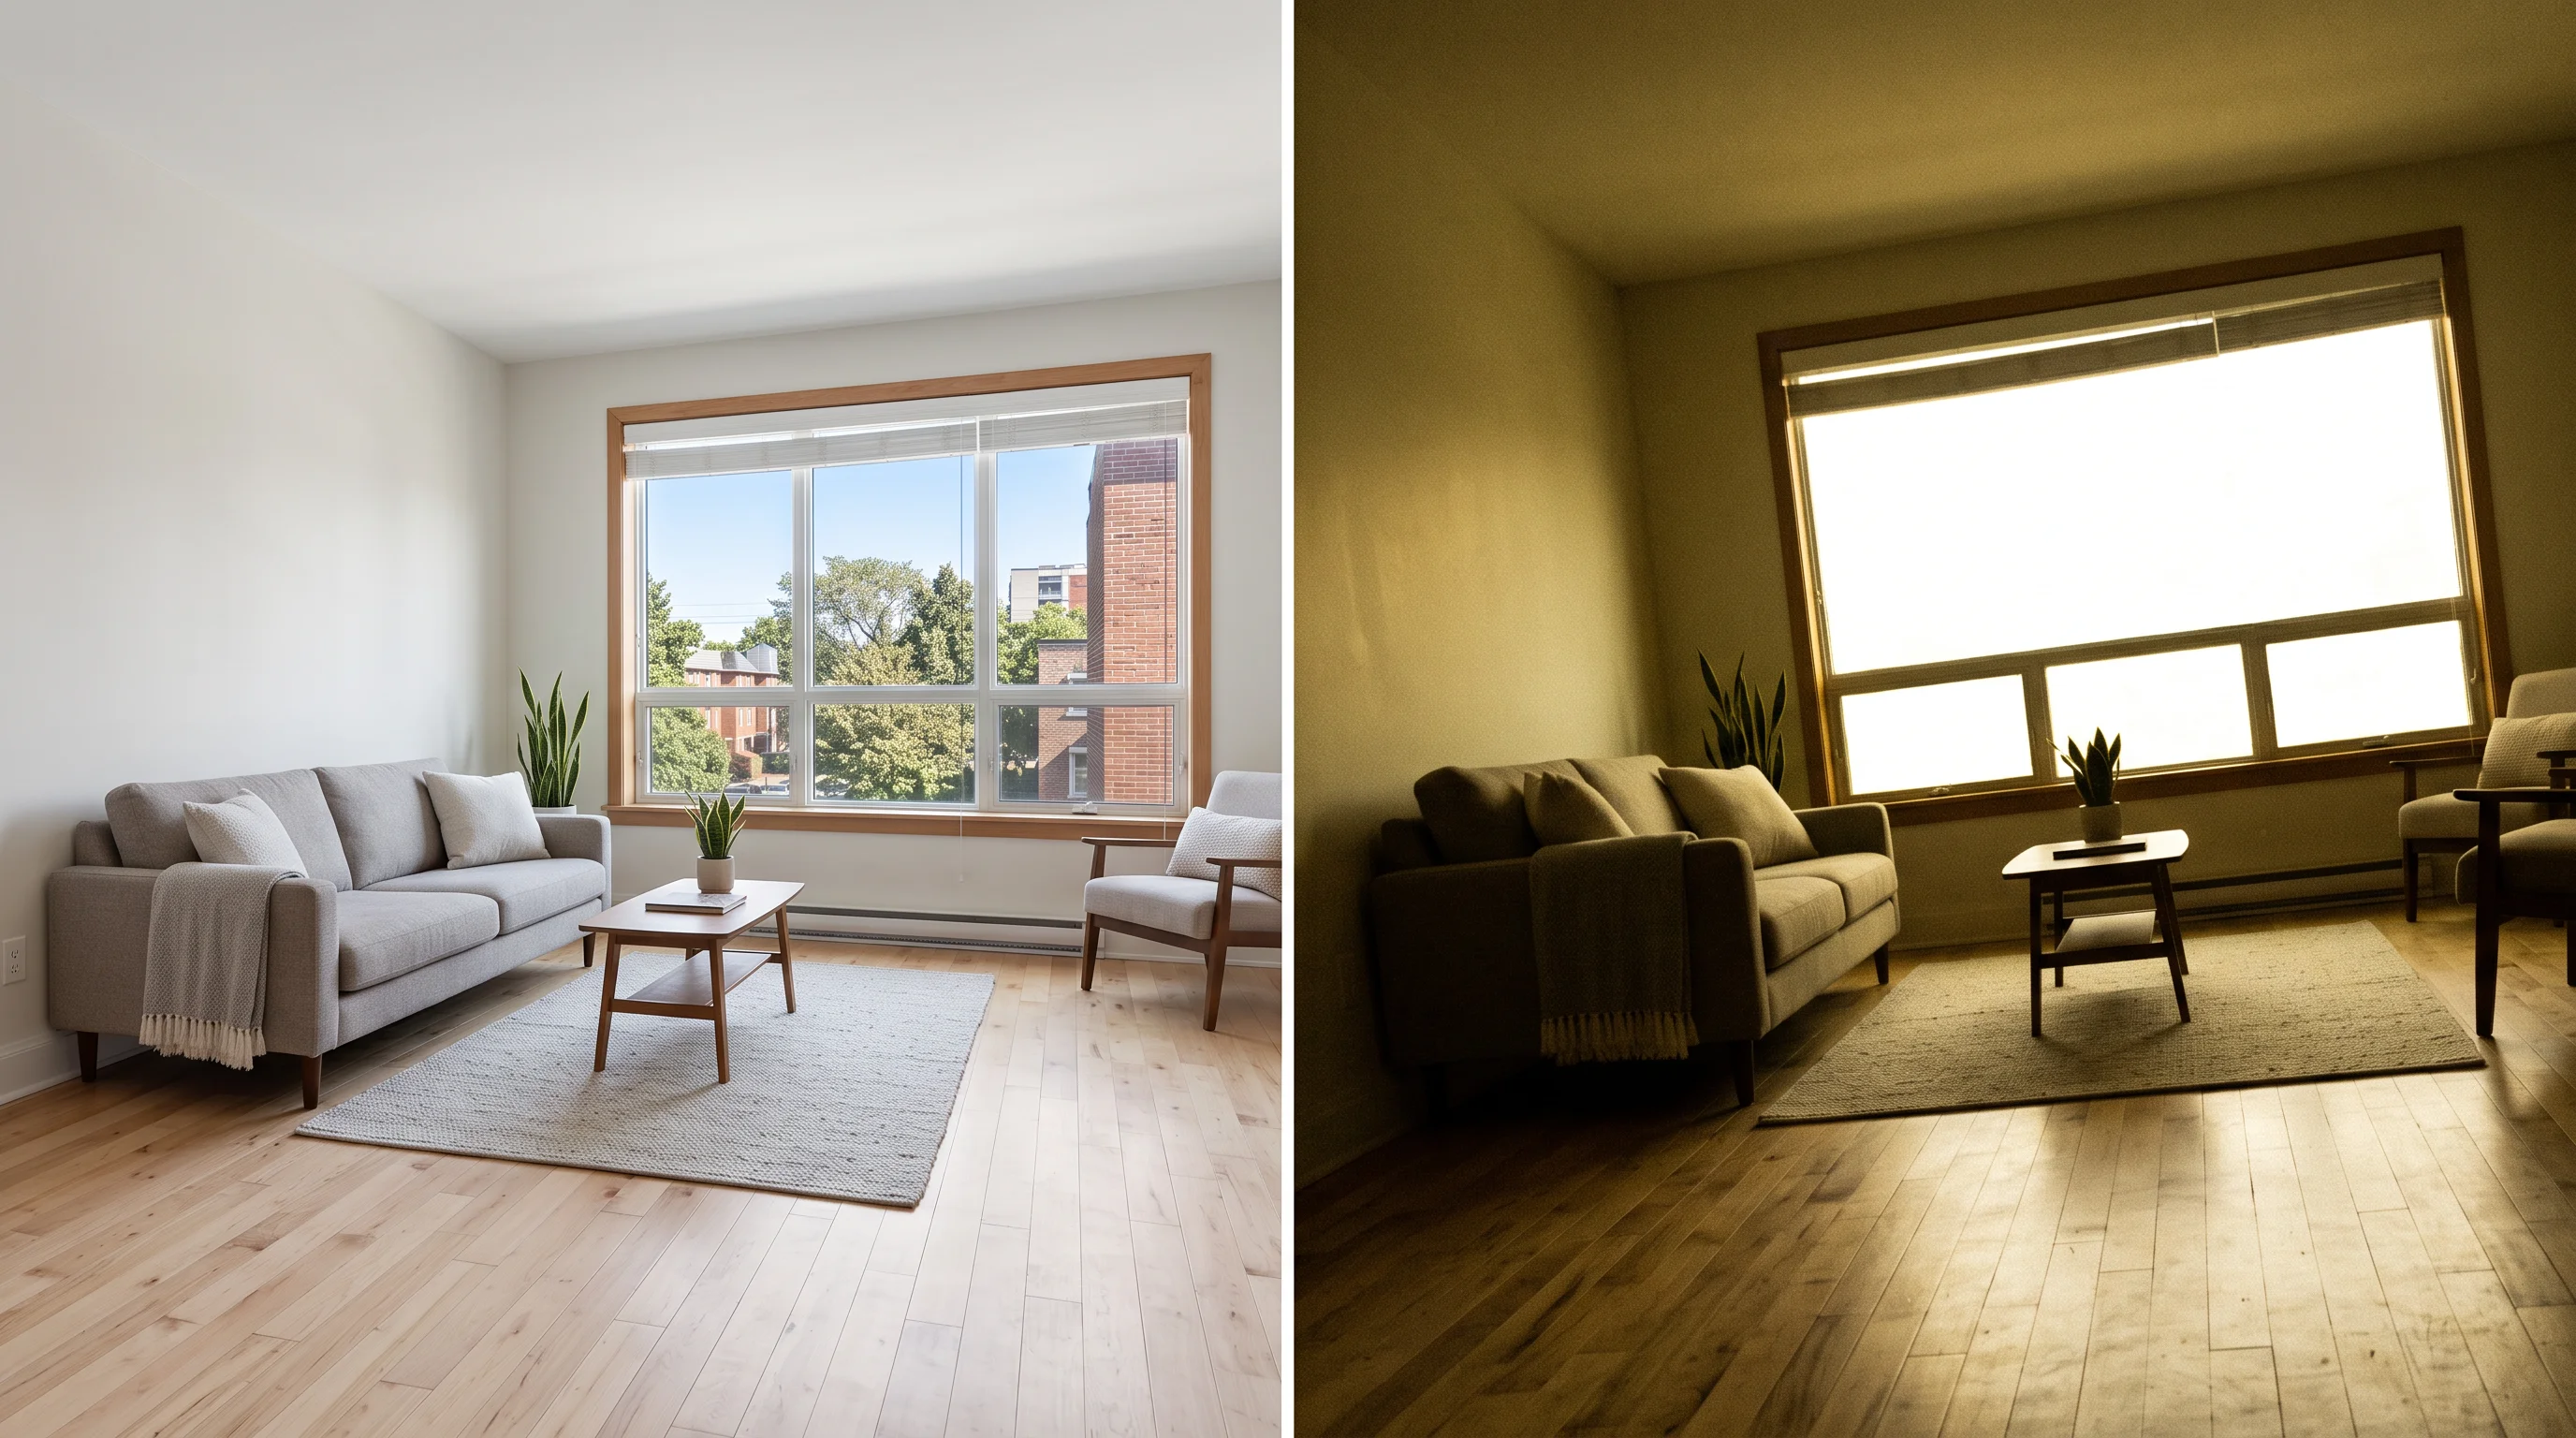
When a tower completes and dozens of investor-owned units list simultaneously — same layouts, same finishes, same appliances — presentation becomes the only remaining differentiator. Toronto leasing specialists describe the gap between professional photos and dark phone images as changing outright how a unit performs online, particularly late at night when renters are scrolling through fifty listings on a phone. If you want the language of the listing itself to do work too, our guide to writing a rental listing that attracts good tenants covers the method.
Response time
This is the variable most completely under a landlord's control and the one most routinely surrendered. An enquiry answered in two hours and an enquiry answered in two days produce different outcomes from the same listing. The same discipline applies once applications arrive — a pre-built process shortens decision time, and our 7-step method for screening a tenant in Ontario sets out a sequence you can run identically for every applicant.
Season, and why it matters less than assumed
Ontario leases cluster to expire between April and July. That brings more demand into the market — and more competing supply at exactly the same moment. The two partly cancel. In a newly completed building where dozens of near-identical units come available together, June can genuinely be slower than February.
The maths most landlords never run
Everything above is judgement until you attach a dollar figure to a day. Once you do, most pricing arguments resolve themselves.
A Toronto condo at $2,577 a month costs roughly $85 per vacant day in rent alone. A Hamilton two-bedroom at about $2,000 costs roughly $66. Fully loaded with carrying costs — which do not pause when the tenant leaves — both are meaningfully higher.
Now the break-even that decides most decisions. Holding out for $100 more per month on a $2,500 unit earns you $1,200 across a twelve-month lease. If that hold-out costs fifteen extra vacant days, you have spent $1,288 to earn $1,200. The break-even sits at roughly 14 vacant days per $100 per month of additional rent. Above that line you are losing money to win an argument.
The same arithmetic applies to incentives. One month free on a twelve-month lease is an 8.3% effective discount. If offering it saves twenty vacant days on a $2,577 unit, you have spent $2,577 to save $1,700 — worse than simply pricing $150 lower from day one, and with the added wrinkle that every future rent increase is calculated from the full face rent rather than the discounted one. For the complete worked model on what vacancy actually costs across every line item, see what an empty unit actually costs you per day.
The line worth carrying away: most Ontario landlords lose more to the extra fortnight than they ever gain from the extra hundred dollars.
Setting the number for a sitting tenant instead? Vacancy pricing and guideline increases are governed by completely different rules. Work out the lawful figure with our Ontario Rent Increase Calculator.
Read your own listing's clock
You do not need a published benchmark to diagnose a listing. You need checkpoints, and the discipline to act on them instead of waiting.

- Day 7, no qualified enquiries → the price is wrong. Not the photos, not the season, not the platform. The price.
- Day 14, showings but no applications → the listing or the unit is overselling. Something in person is not matching what people expected online.
- Day 21, still nothing → reprice by 3–5% rather than adding an incentive. In a market clearing in under a month, three weeks is already a signal.
- Day 30, still nothing → you are in a different segment than you thought you were. Re-read the four segments above and reset your expectations against the right one.
It also helps to count the whole timeline, not just the listed portion. Here is where the days actually go:
| Stage | Typical duration | Note |
|---|---|---|
| Notice received → unit ready | 0–14 days | Turnover work; the clock most landlords forget to count |
| Listing live → first qualified enquiry | 24–72 hours | Nothing in 72 hours at peak season means the price is wrong |
| Enquiries → showings | 3–7 days | Response speed is the variable you control most directly |
| Showings → complete application | 2–5 days | A pre-built application shortens this materially |
| Screening → decision | 1–3 days | Written consent comes before any credit check |
| Lease signed → move-in | 0–30 days | Often the largest hidden vacancy block |
| Listing to lease, well-priced GTA unit | ~14–27 days | Consistent with 0.9 months of supply |
| Listing to lease, new-build or campus-adjacent | 45–90+ days | Consistent with CMHC's reporting |
What to expect through the rest of 2026
Three forces are pulling in different directions, and the net effect is regional rather than provincial.
Supply is thinning. Condo construction across the GTHA is 64% below its 2023 peak. Purpose-built rental starts reached 6,291 units in the first half of 2026, the highest first-half total in decades — but purpose-built construction is replacing only part of what the unwinding condo pipeline is taking out, since roughly half of new condo supply typically ends up rented.
The demand base shrank, then stabilised. Ontario's population fell 0.7% in 2025, a loss of 119,070 people and the first decline in records going back to 1951, driven by non-permanent residents leaving. Against that, CMHC forecasts 2.0% household growth in Toronto in 2026 — the strongest of any major Canadian metropolitan area — as easing costs let previously suppressed households form.
Labour is improving off a weak base. Ontario's unemployment rate fell to 6.8% in July 2026, down from a recent high of 7.9% in December 2025 and the lowest since July 2024.
Net call: time-to-lease keeps compressing in the City of Toronto through the autumn, stays elevated in the 905 and Southwestern Ontario, and improves modestly in Ottawa as the 2026 completion wave absorbs. If you are a tenant, the negotiating leverage that existed through 2025 is thinning in the core and holding in the suburbs — which is a genuine argument for widening your search radius rather than your budget.
Practical takeaways
Seven things to do differently on your next turnover:
- Pull three live comparables from this month, in your building or immediate area — never last year's peak.
- Draft the listing before the unit is ready, and publish on day one of vacancy rather than day fourteen.
- Budget for professional photography if you are in a building where units are near-identical.
- Set a response-time standard and hold it — 24 hours or better.
- Calculate your own vacant-day cost before you decide what to hold out for.
- Apply the 14-days-per-$100 break-even before rejecting a reasonable offer.
- Diarise the day 7 / 14 / 21 / 30 checkpoints and act on them rather than waiting for the market to move.
Quick wins: reprice to current comparables, publish immediately on notice, answer enquiries same day, fix the photos. Longer-term: structure lease end dates to land in the April–July window, track your own portfolio's days-to-lease by segment, and build a reusable application and screening workflow so decision time stops quietly adding vacant days.
Frequently asked questions
How long does it take to rent a unit in Ontario?
Roughly two to four weeks from listing to signed lease for a well-priced unit in most Ontario markets. Greater Toronto condo inventory was clearing at about 0.9 months of supply in Q2 2026 — roughly 27 days. New-build units, studios and units near post-secondary campuses take substantially longer; CMHC reported operators needing months to fill some of them.
Is there an official days-on-market figure for Ontario rentals?
No. TRREB publishes days-on-market for home sales, not leases. CMHC's Rental Market Survey measures vacancy and turnover. Rentals.ca and Urbanation track asking rents and listing inventory. None publish a rental days-on-market statistic, which is why most answers to this question are anecdotal.
Is it a renter's market in Ontario right now?
It depends where. In the City of Toronto, listings were down about 6% year over year in July 2026 and rents rose 1.6% month over month — that is tightening, not softening. In Brampton, Mississauga, Oakville, Oshawa and Markham, rents were still falling more than 7% annually. The same province, two different markets.
How long should I wait before lowering the rent?
If a well-photographed listing generates no qualified enquiries in the first seven days, the price is the problem. By day 21 in a market clearing in under a month, a 3–5% reprice usually beats adding an incentive.
Does the season change how fast a unit rents?
Yes, but less than most advice suggests. Ontario leases cluster to expire between April and July, so summer brings more demand and more competing listings at once. In a newly completed building where dozens of near-identical units list together, June can be slower than February.
Is offering a free month better than lowering the rent?
One month free on a twelve-month lease is an 8.3% discount. On a $2,577 unit, that is roughly $2,577 given away, and every future increase is still calculated from the full face rent. Pricing $150 lower from day one costs $1,800 over the same lease and usually leases faster. Run both numbers before defaulting to the incentive.
The Ontario Renter's Timing Checklist: 18 Steps to a Better Deal
Most renters can't tell whether a listing has been sitting for a reason — or whether they're the one with leverage. This free checklist shows you how to read a listing's clock, time your search to the Ontario market, and know exactly what a landlord can and cannot lawfully ask you for.
Get Free PDF →The bottom line
No Ontario body publishes a rental days-on-market figure, so the honest answer has to be derived: roughly 27 days for the market to clear at 0.9 months of supply, with a wide and knowable spread around it. Two to four weeks is the realistic expectation for a well-priced, well-presented unit. Weeks to months if it is new-build, studio-sized, or campus-adjacent. And Ontario is not one market — Toronto is tightening while several 905 municipalities are still falling.
But the number that should actually govern your decisions is not the market average at all. It is your own vacant-day cost measured against whatever you are holding out for. Run that calculation once and most pricing questions answer themselves — because for most Ontario landlords, the extra fortnight costs more than the extra hundred dollars ever returns.
Next steps: work out your own vacant-day number, set the day 7 / 14 / 21 / 30 checkpoints on your current listing, and start logging your days-to-lease so that next year you have the benchmark nobody else publishes.
Every day your unit sits unlisted is a day you're paying for
Build a complete, compliant Ontario listing in minutes — Human Rights Code-safe language, the lawful money lines, and the facts tenants actually filter by, in the right order.
Free • No signup required • Updated for the Bill 60 changes in force 21 Sep 2026
Related resources
- What an Empty Unit Actually Costs You Per Day — the full vacancy-cost model behind the break-even above.
- How to Write a Rental Listing That Attracts Good Tenants — the writing method, including the language layer most listings get wrong.
- Where to List a Rental in Ontario: 9 Sites Compared — platform-by-platform, dated and honestly costed.
- How to Screen a Tenant in Ontario: The 7-Step Method — the lawful sequence from listing to lease.
- Rent Control and What You Can Advertise — why vacancy decontrol means the advertised rent is yours to set, and what it commits you to.
- Free Rental Listing Tools for Ontario Landlords — the honest toolkit for each job in the listing workflow.
- Ontario Rent Increases 2027: The Complete N1 Guide — the 1.9% guideline and the serve-date maths for sitting tenants.
This article is general information, not legal advice. All figures are as of August 2026 and carry their original source and month. Market data changes monthly; verify current rules at ontario.ca or with the Landlord and Tenant Board before making decisions about your own tenancy or property.


