

Three weeks on the market with nothing to show for it, and the question almost every Ontario landlord asks is the same one: should I drop the rent?
About half the time, that is the wrong lever. Not because the rent is necessarily right, but because the price was never the part that broke. A stalled listing feels like a mystery and isn't one — it has four stages, each with a measurable ratio, and each ratio points at a different cause. Views without enquiries is a price or presentation problem. Enquiries without showings is a response problem. Showings without applications means the unit is underdelivering against the listing. Applications without a signed lease is a speed or terms problem.
Almost no Ontario landlord tracks any of this. What they have is a listing date, a pile of messages, and eventually a lease date. This guide, current as of August 2026, gives you the four stage ratios and what each one diagnoses, the benchmarks to measure against — with honest labelling of where they come from — a five-column tracker you can run on a single unit, the three checkpoint dates, and the dollar cost of guessing wrong. It is general information rather than legal advice.
The Leasing Funnel Tracker: Diagnose Why Your Unit Isn't Renting
Three weeks listed and no applications? Dropping the rent is the wrong lever about half the time. This free tracker gives you the four stage ratios, the day 7 / 14 / 21 checkpoints, and a five-column log that tells you exactly which stage is broken before you spend a dollar fixing the wrong one.
Get Free PDF →Why nobody can tell you what normal looks like
Start with the honest problem: no Canadian organisation publishes leasing funnel conversion benchmarks.
TRREB publishes leases and listings. CMHC publishes vacancy and turnover. Urbanation publishes inventory and absorption. Rentals.ca publishes asking rents. None of them publishes stage-level conversion. Every funnel benchmark in circulation is American, and most of it describes enterprise multifamily portfolios with CRMs, guest cards and dedicated leasing offices — not an Ontario landlord with one unit and a phone.
What can be derived honestly
The listings-to-leases ratio. TRREB recorded 22,491 condo leases against 28,406 units listed in Q3 2025 — roughly 79%. In Q1 2026, about 16,365 leases against 24,000 listings — roughly 68%. That is a blunt instrument, and it deserves its caveat: listings and leases counted in the same quarter are partly different cohorts, and the drop between those two figures is seasonal as much as structural. But the direction is informative.
The outer clock. GTHA condo months of supply fell to 0.9 months in Q2 2026 from 1.2 a year earlier — inventory clearing in roughly 27 days (Urbanation, July 27, 2026). That is the window your entire funnel has to fit inside, and our piece on how long it takes to rent a unit in Ontario works through that derivation in full.
The convergence worth noticing
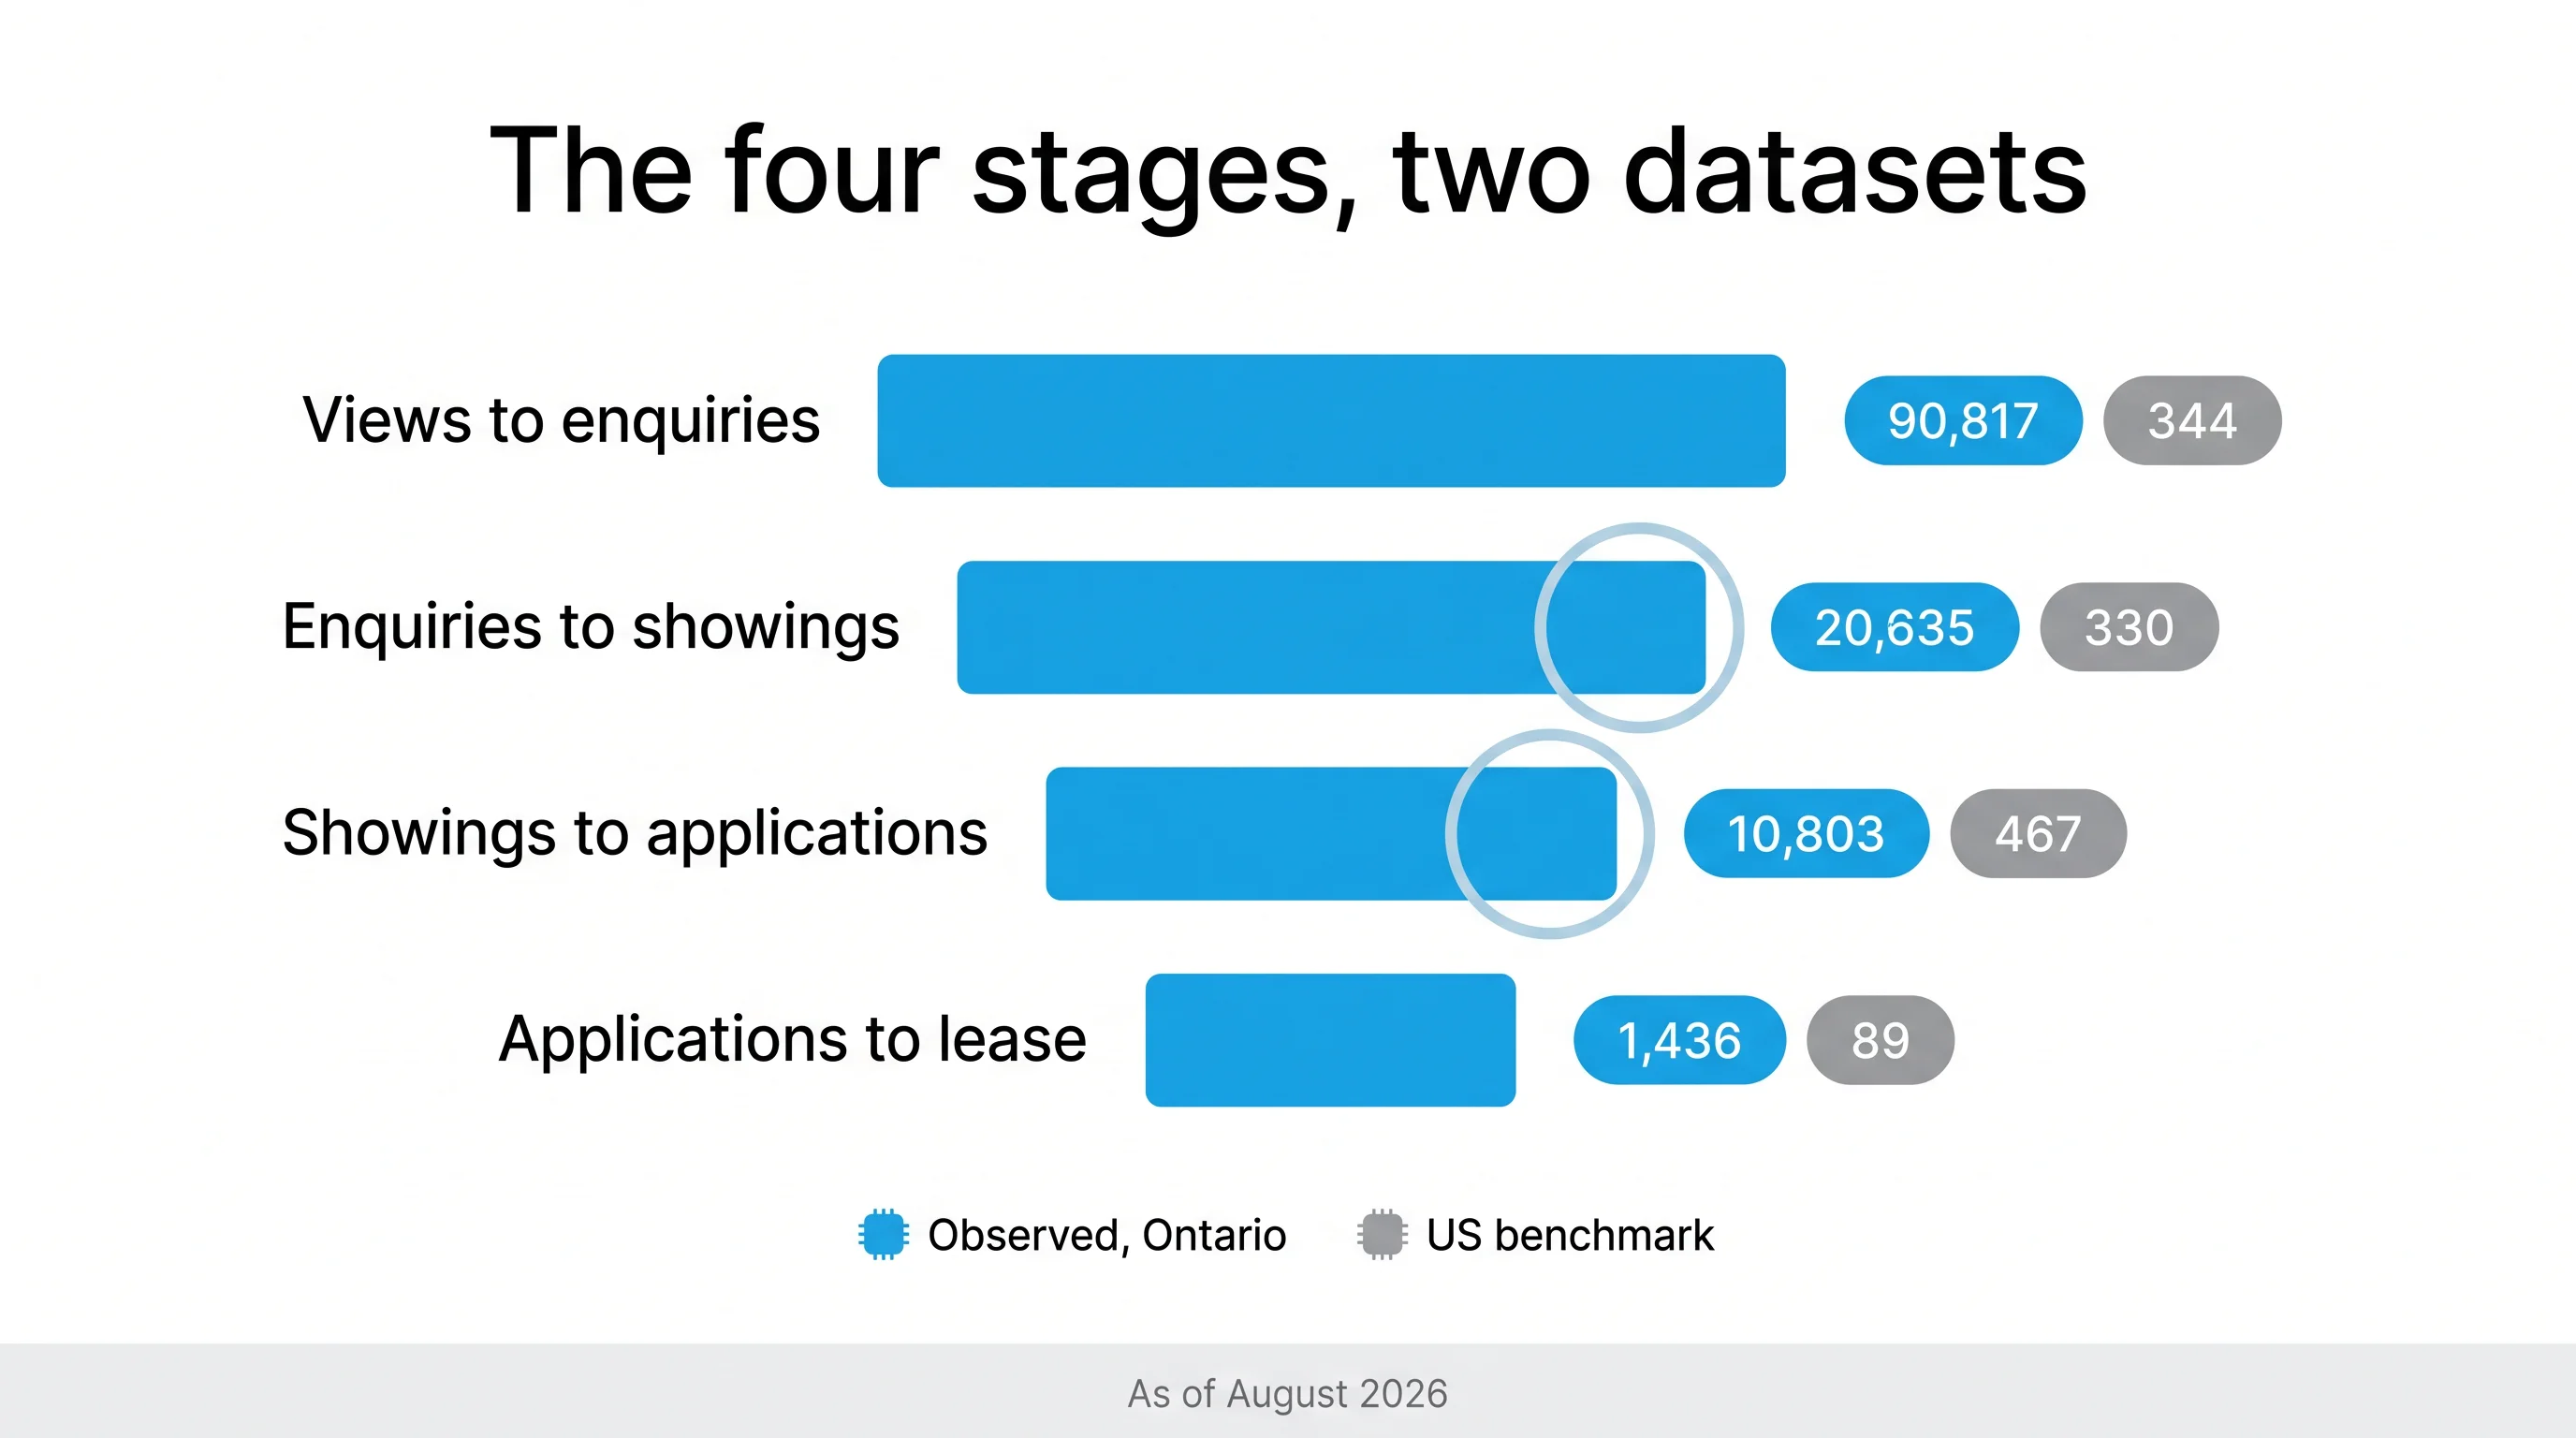
Our own Ontario observation of a well-priced listing produced roughly 40 enquiries → 10 real conversations → 5 showings → 2 applications. The US multifamily benchmark set puts inquiry-to-showing at 25%, showing-to-application at 40%, and approval-to-lease at 70% (RentViewer, via Leasey.AI, May 2026 — US data).
Our 40-to-10 is 25%. Our 5-showings-to-2-applications is 40%. Two unrelated datasets, the same shape.
That is the finding this whole article rests on: the absolute numbers don't travel across borders, but the ratios apparently do. Which is what makes a diagnostic possible in a market where nobody publishes the benchmarks.
Definitions, because sloppy ones produce flattering nonsense
- An enquiry is a unique person, not a message. One person sending four messages is one enquiry.
- A showing is a tour that actually happened. Not booked. Not confirmed. Happened.
- An application is a completed application formally submitted. Not started, not partially filled.
Get these wrong and your ratios will look better than your funnel is, which is the worst possible outcome for a diagnostic.
The four stages and what each one diagnoses
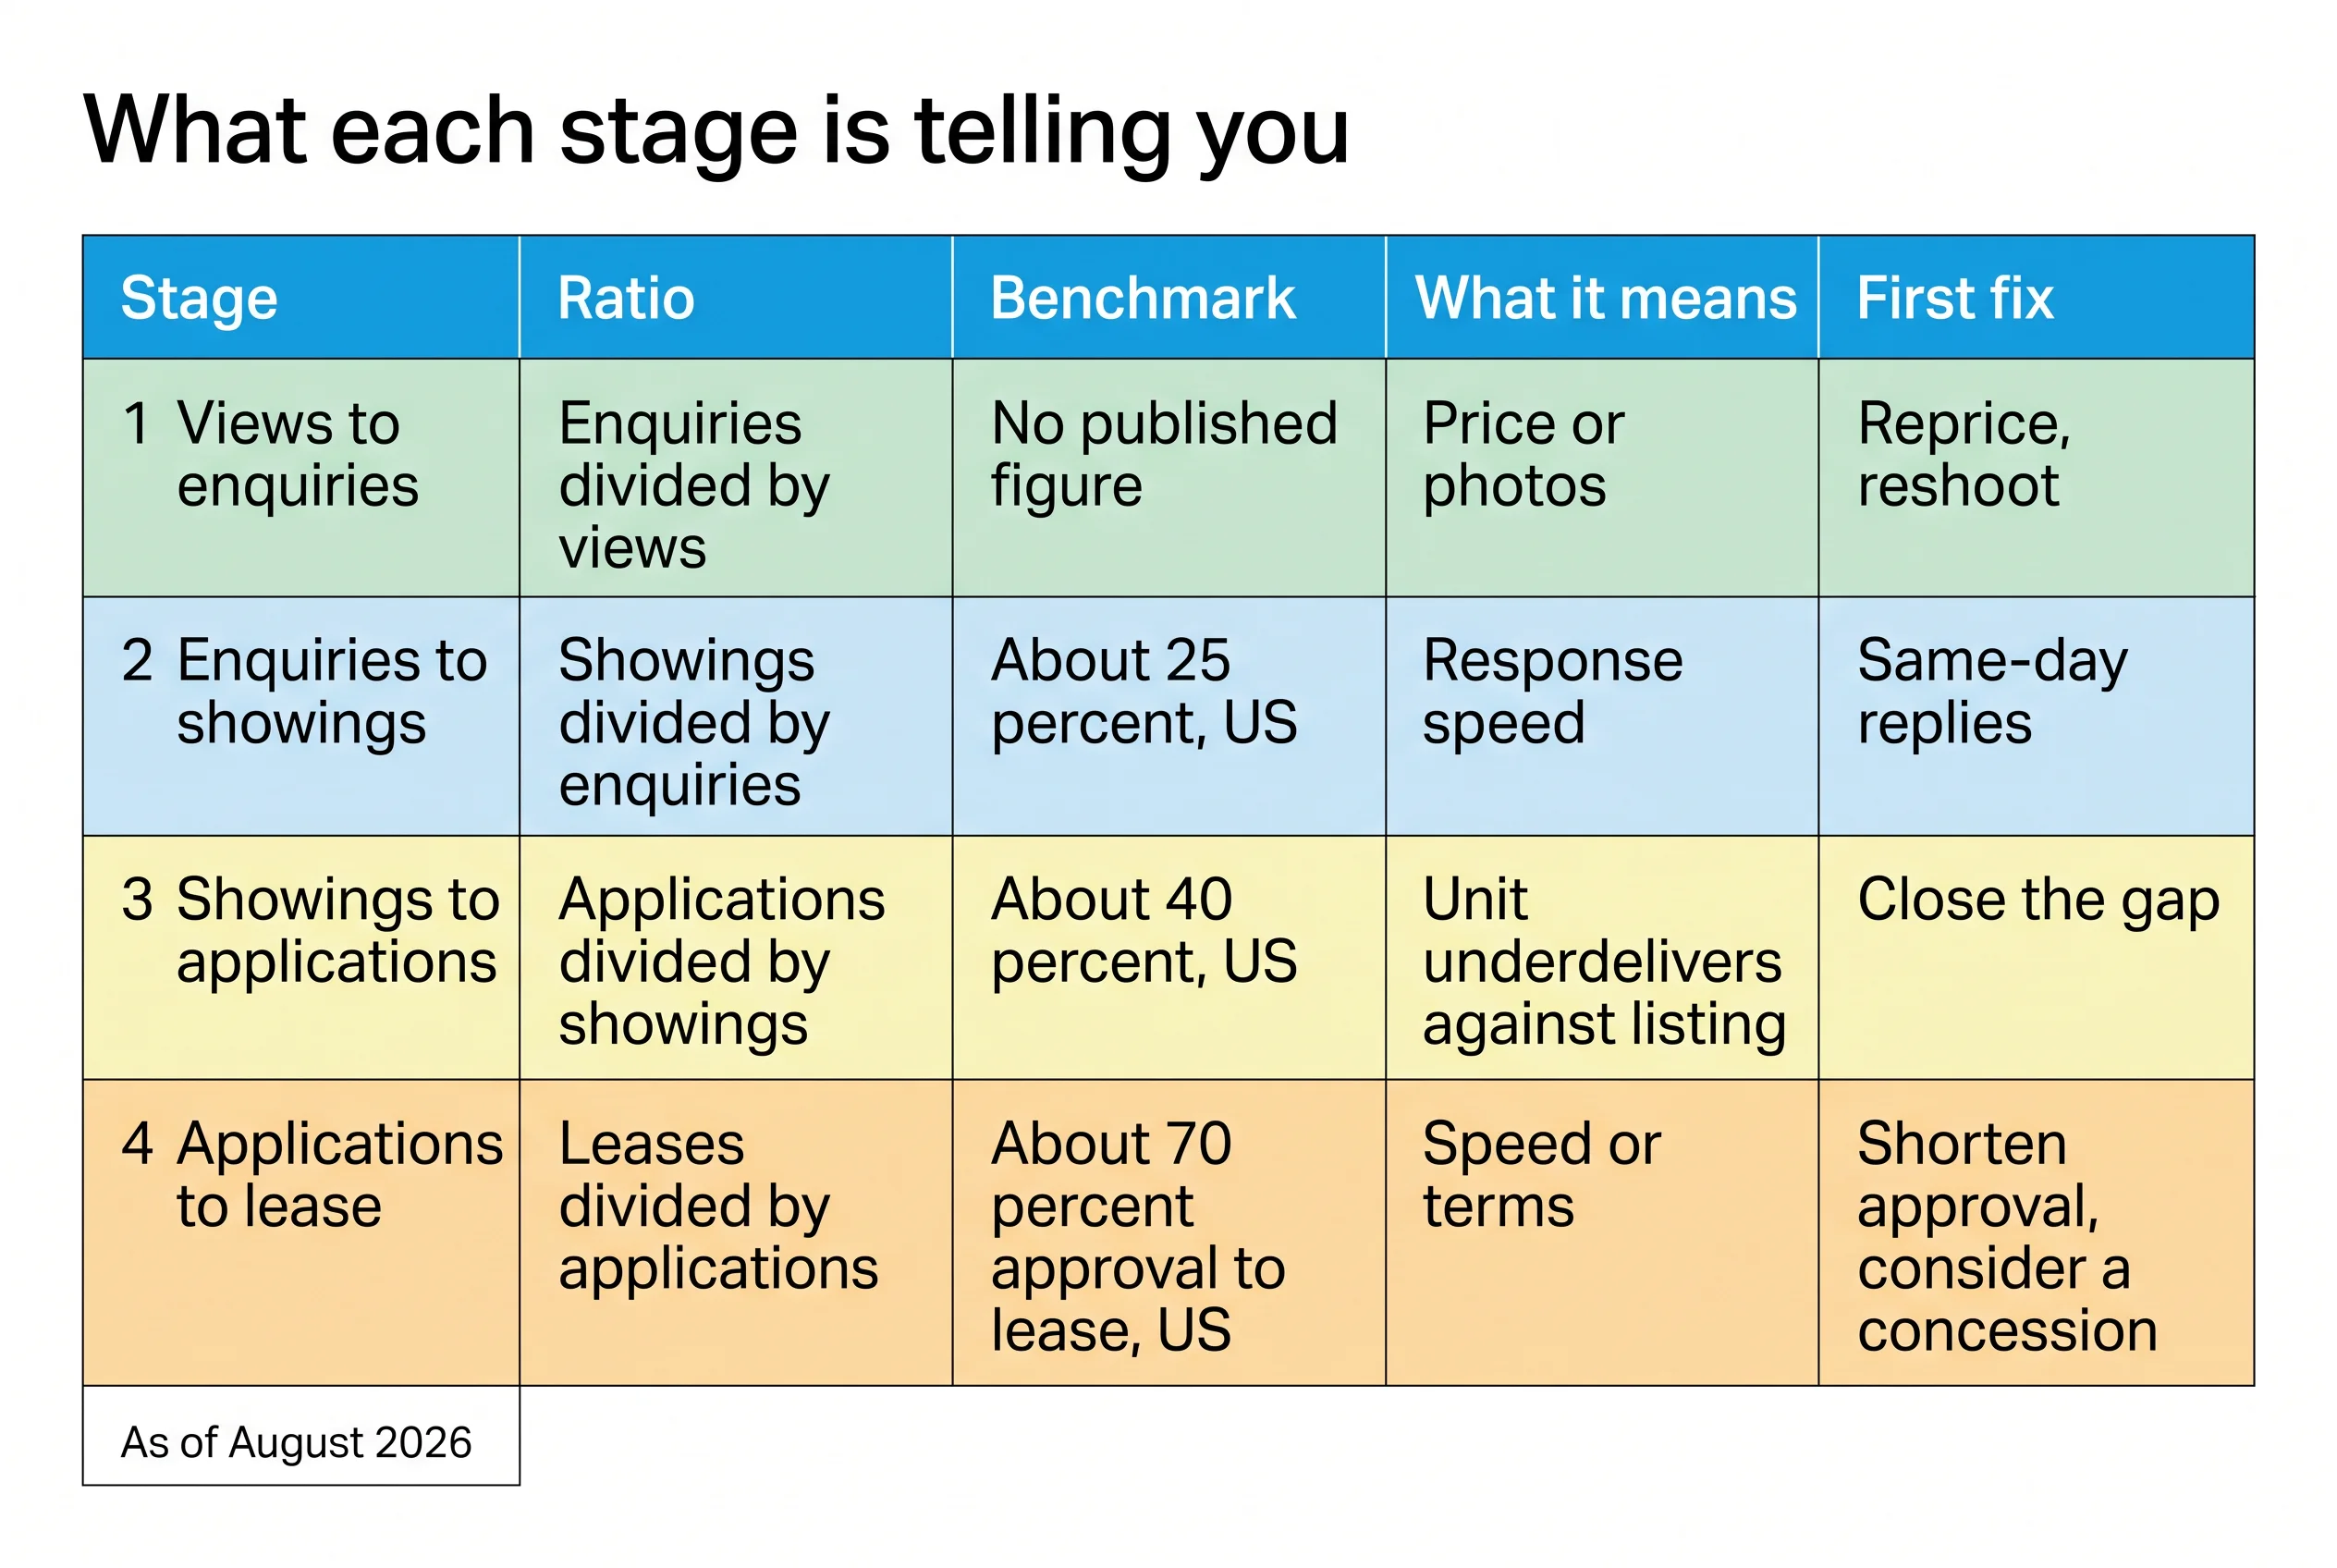
Stage 1 — Views to enquiries
No published benchmark exists for this ratio anywhere, in any country, so you are measuring against your own baseline. Symptom: listing live seven days, few or no enquiries. Most likely cause: price above the micro-market, or the photographs.
One subtlety worth knowing, because it catches people out: overpricing does not always suppress enquiries. Property managers describe a common pattern where pricing anchored to last year's peak produces plenty of enquiries, plenty of tours, and very few completed applications. The damage shows up at stage 3, not stage 1. So a healthy enquiry count does not clear the price of suspicion — it just moves the question downstream.
Stage 2 — Enquiries to showings (benchmark ~25%, US)
This is where most prospects vanish. Three of every four people who made contact never set foot in the unit. Symptom: messages arrive, showings don't get booked. Most likely cause: response speed, or a listing that omits a fact people need before committing an evening to a viewing.
Stage 3 — Showings to applications (benchmark ~40%, US)
Symptom: people tour and disappear. Most likely cause: the unit underdelivers against the listing. This stage is essentially a measurement of the gap between what your ad promised and what the visitor actually found — which is why it is usually a listing accuracy problem rather than a unit problem.
Note that this is the stage where the US benchmark and our Ontario observation agree most exactly.
Stage 4 — Applications to signed lease (approval-to-lease benchmark ~70%, US)
The stage most landlords do not know exists. Symptom: approved applicants go elsewhere. Most likely cause: speed, terms, or a competing incentive.
Operators assume approval signals commitment. It does not. An approved applicant waiting three days for a lease document has time to reconsider, find a competing offer, or simply lose momentum — and in a market where renters are shopping several units in parallel, three days is a long time to leave someone holding an unsigned decision.
The valve, not the step
Here is the framing that reorganises everything above. Think of the showing stage as a valve rather than a step. At a 25% showing rate it stays mostly closed, and every downstream stage works with a fraction of the pool that came in. That fraction is the ceiling on everything after it.
Optimising the application stage while the showing stage leaks is solving the wrong problem first. US portfolio data makes the same point at scale: average guest-card-to-lease conversion sits at 8.7% while top performers reach 16.5%, and that near-doubling is not created at the approval stage, where the industry already converts at 70%. It is created at inquiry-to-showing, where the variance between average and good is widest. The lesson holds at one unit or a thousand — fix the earliest broken stage first.
How to measure this on one unit
The enterprise version of this requires a CRM and a unified guest card. The single-unit version requires a spreadsheet with five columns.
The tracker
Date received · name · platform · date replied · outcome. That is the entire instrument. Add three fields at the unit level — listing date, asking rent, and three current comparables recorded at the moment you list.
A useful coincidence: this is the same log that Ontario landlords should be keeping at the enquiry stage for Human Rights Code reasons, since a record showing you replied to everyone in the order they arrived is the only evidence you treated applicants consistently. One artifact, two jobs.
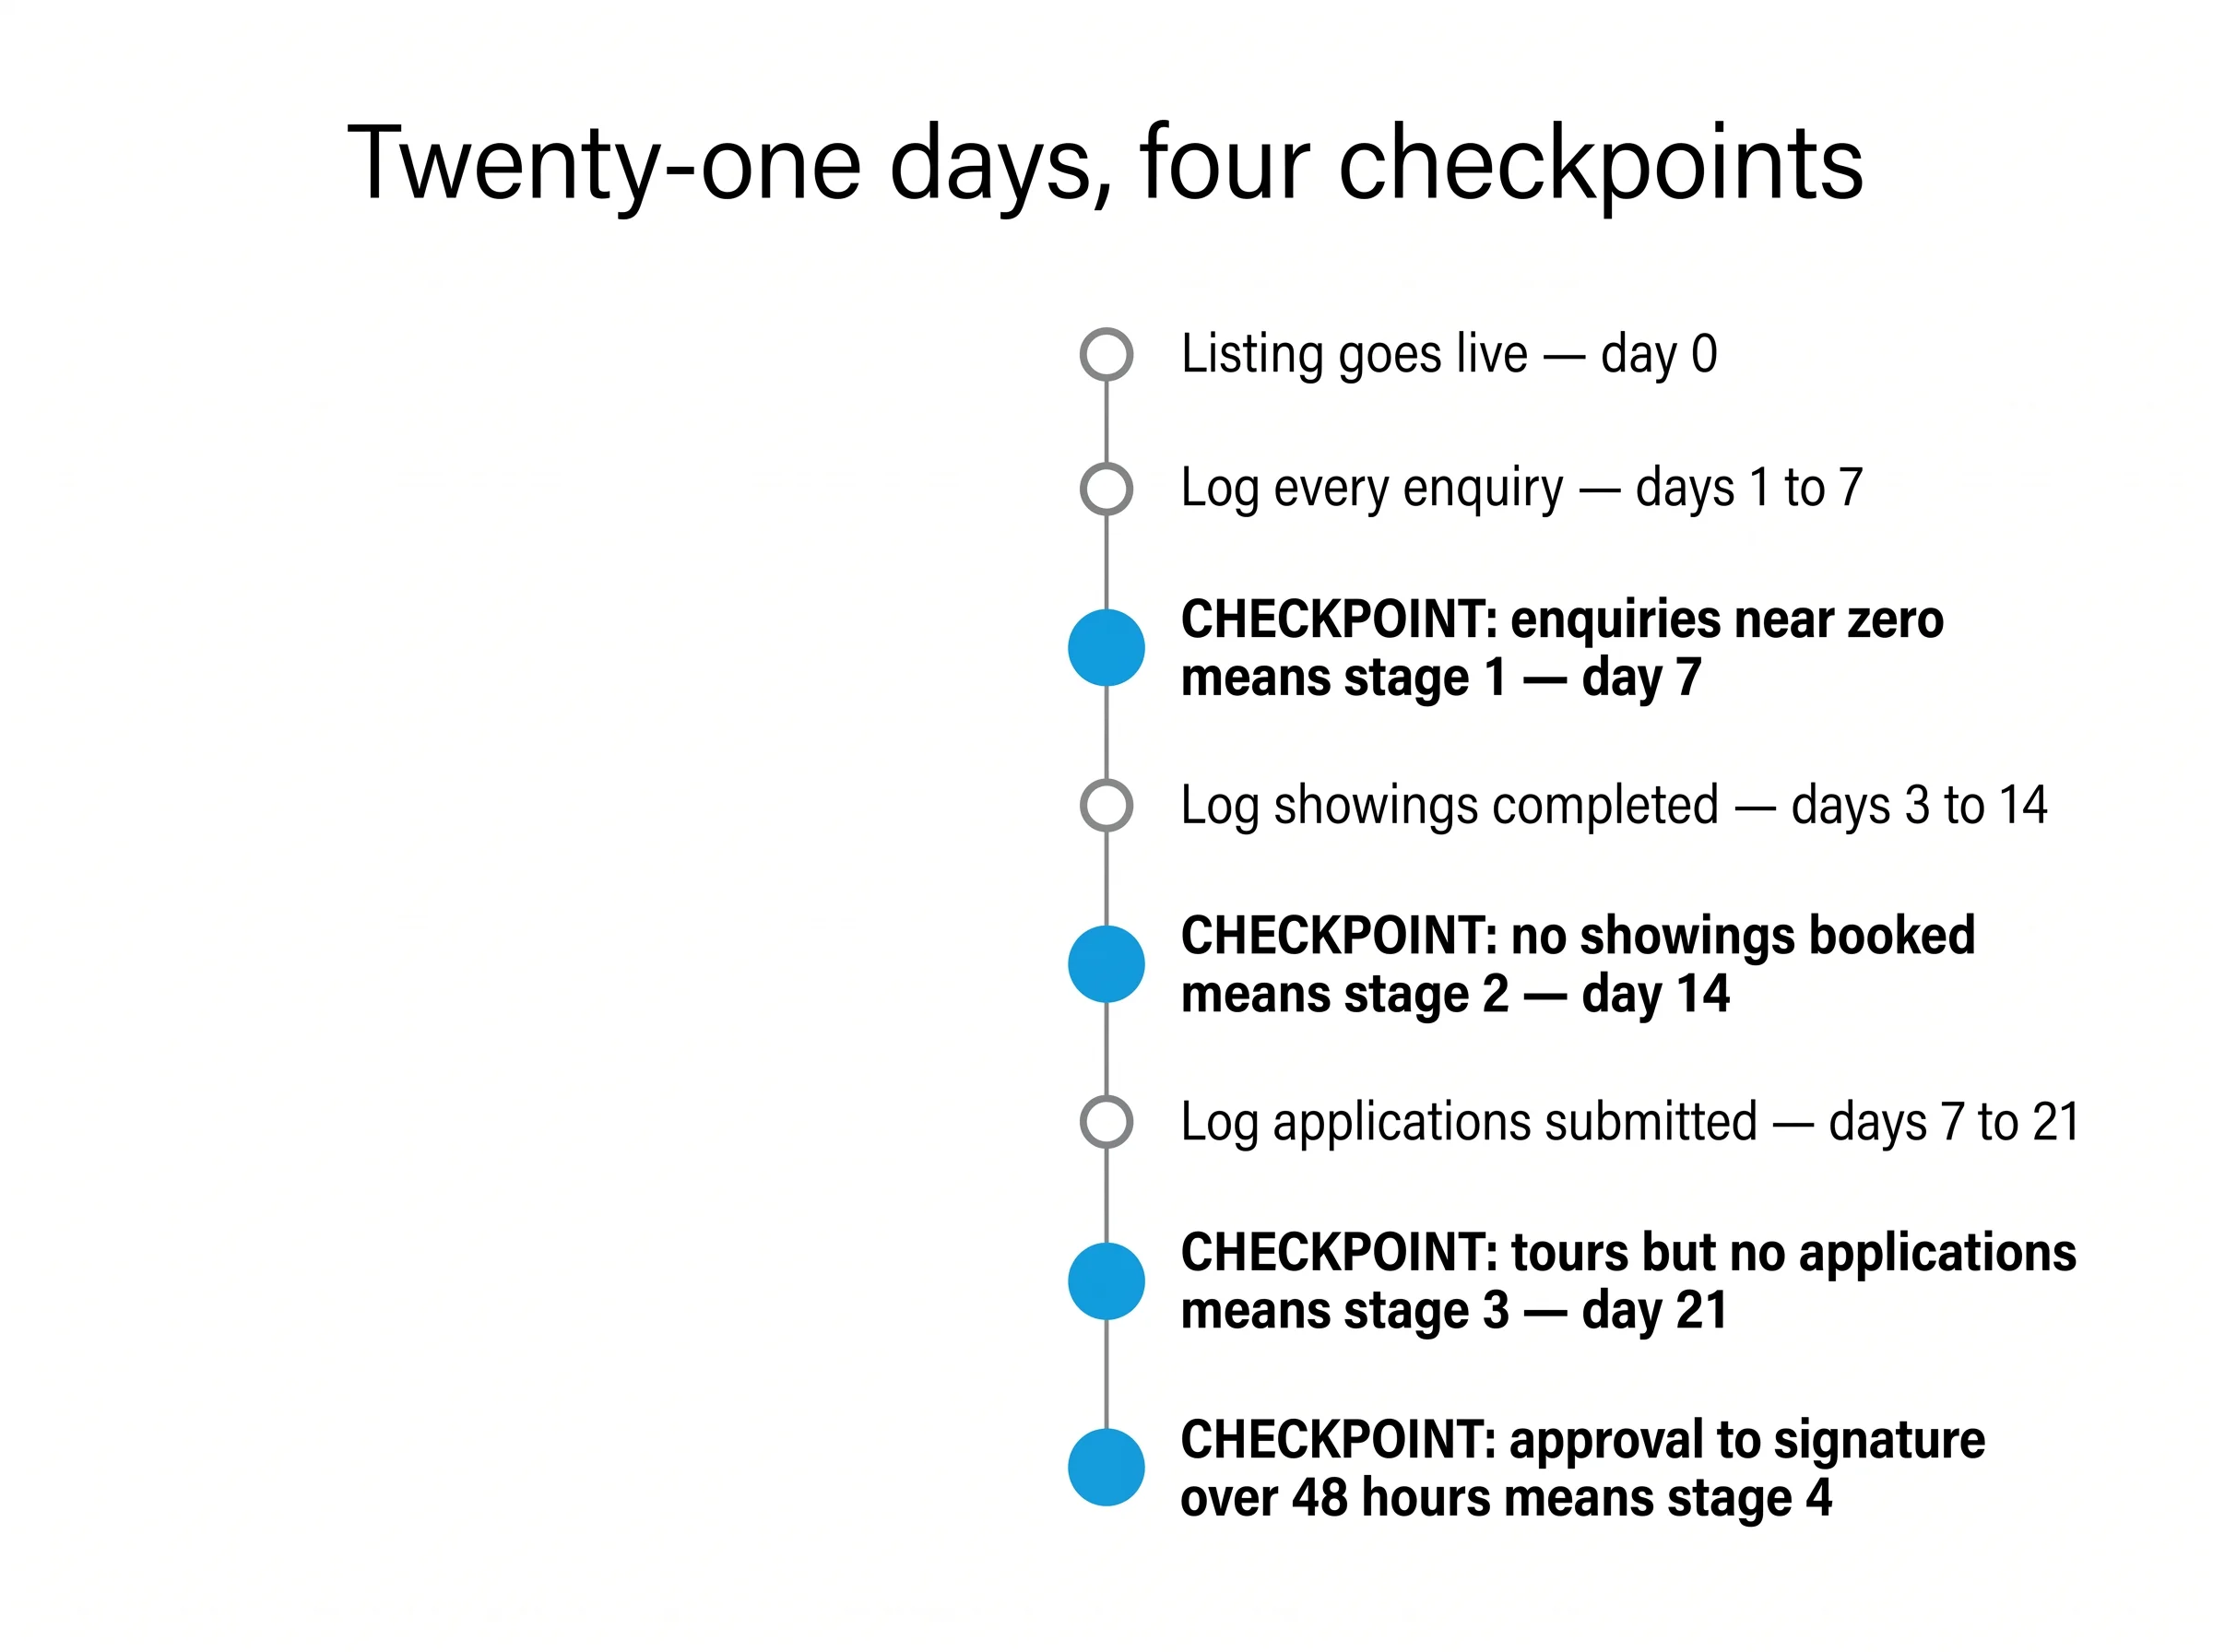
The four checkpoints
- Day 7 — enquiries near zero? That is stage 1.
- Day 14 — enquiries arriving but no showings booked? That is stage 2.
- Day 21 — people touring but not applying? That is stage 3.
- On approval — more than 48 hours to signature? That is stage 4 risk.
Compare like seasons, or don't compare
Ontario leases cluster to expire between April and July, and that cluster moves every ratio in the funnel. A landlord comparing a January funnel against a June funnel and concluding something changed about the unit has misread the calendar as performance. Same season, or no comparison.
What normal looks like where you are
The same ratios produce very different absolute numbers by market. In the City of Toronto — supply at 0.9 months, listings down roughly 6% year over year — high volume masks a weak stage, so the cost shows up as lost opportunity rather than a stalled unit. In the 905, where Markham asking rents fell 11.9% year over year and Brampton, Mississauga, Oakville and Oshawa all fell more than 7%, lower volume per listing means one broken stage stalls the unit outright. New-build lease-ups and campus-adjacent units carry CMHC's highest vacancies, so diagnosis there starts with visibility rather than conversion.
What it costs to measure, and what it costs not to
Measuring costs a spreadsheet and about two minutes per enquiry. Not measuring costs real money. A Toronto condo at $2,577 runs roughly $85 per vacant day, so three weeks spent fixing the wrong stage is about $1,785 spent on a hypothesis — and our guide to what an empty unit actually costs you per day shows why the fully loaded figure is higher still.
The specific waste is worth naming. Repricing by $150 a month when the actual problem was response speed costs $1,800 over a twelve-month lease and leaves the stall exactly where it was.
The fixes you can lawfully use in Ontario
Here is where imported American advice becomes actively dangerous.
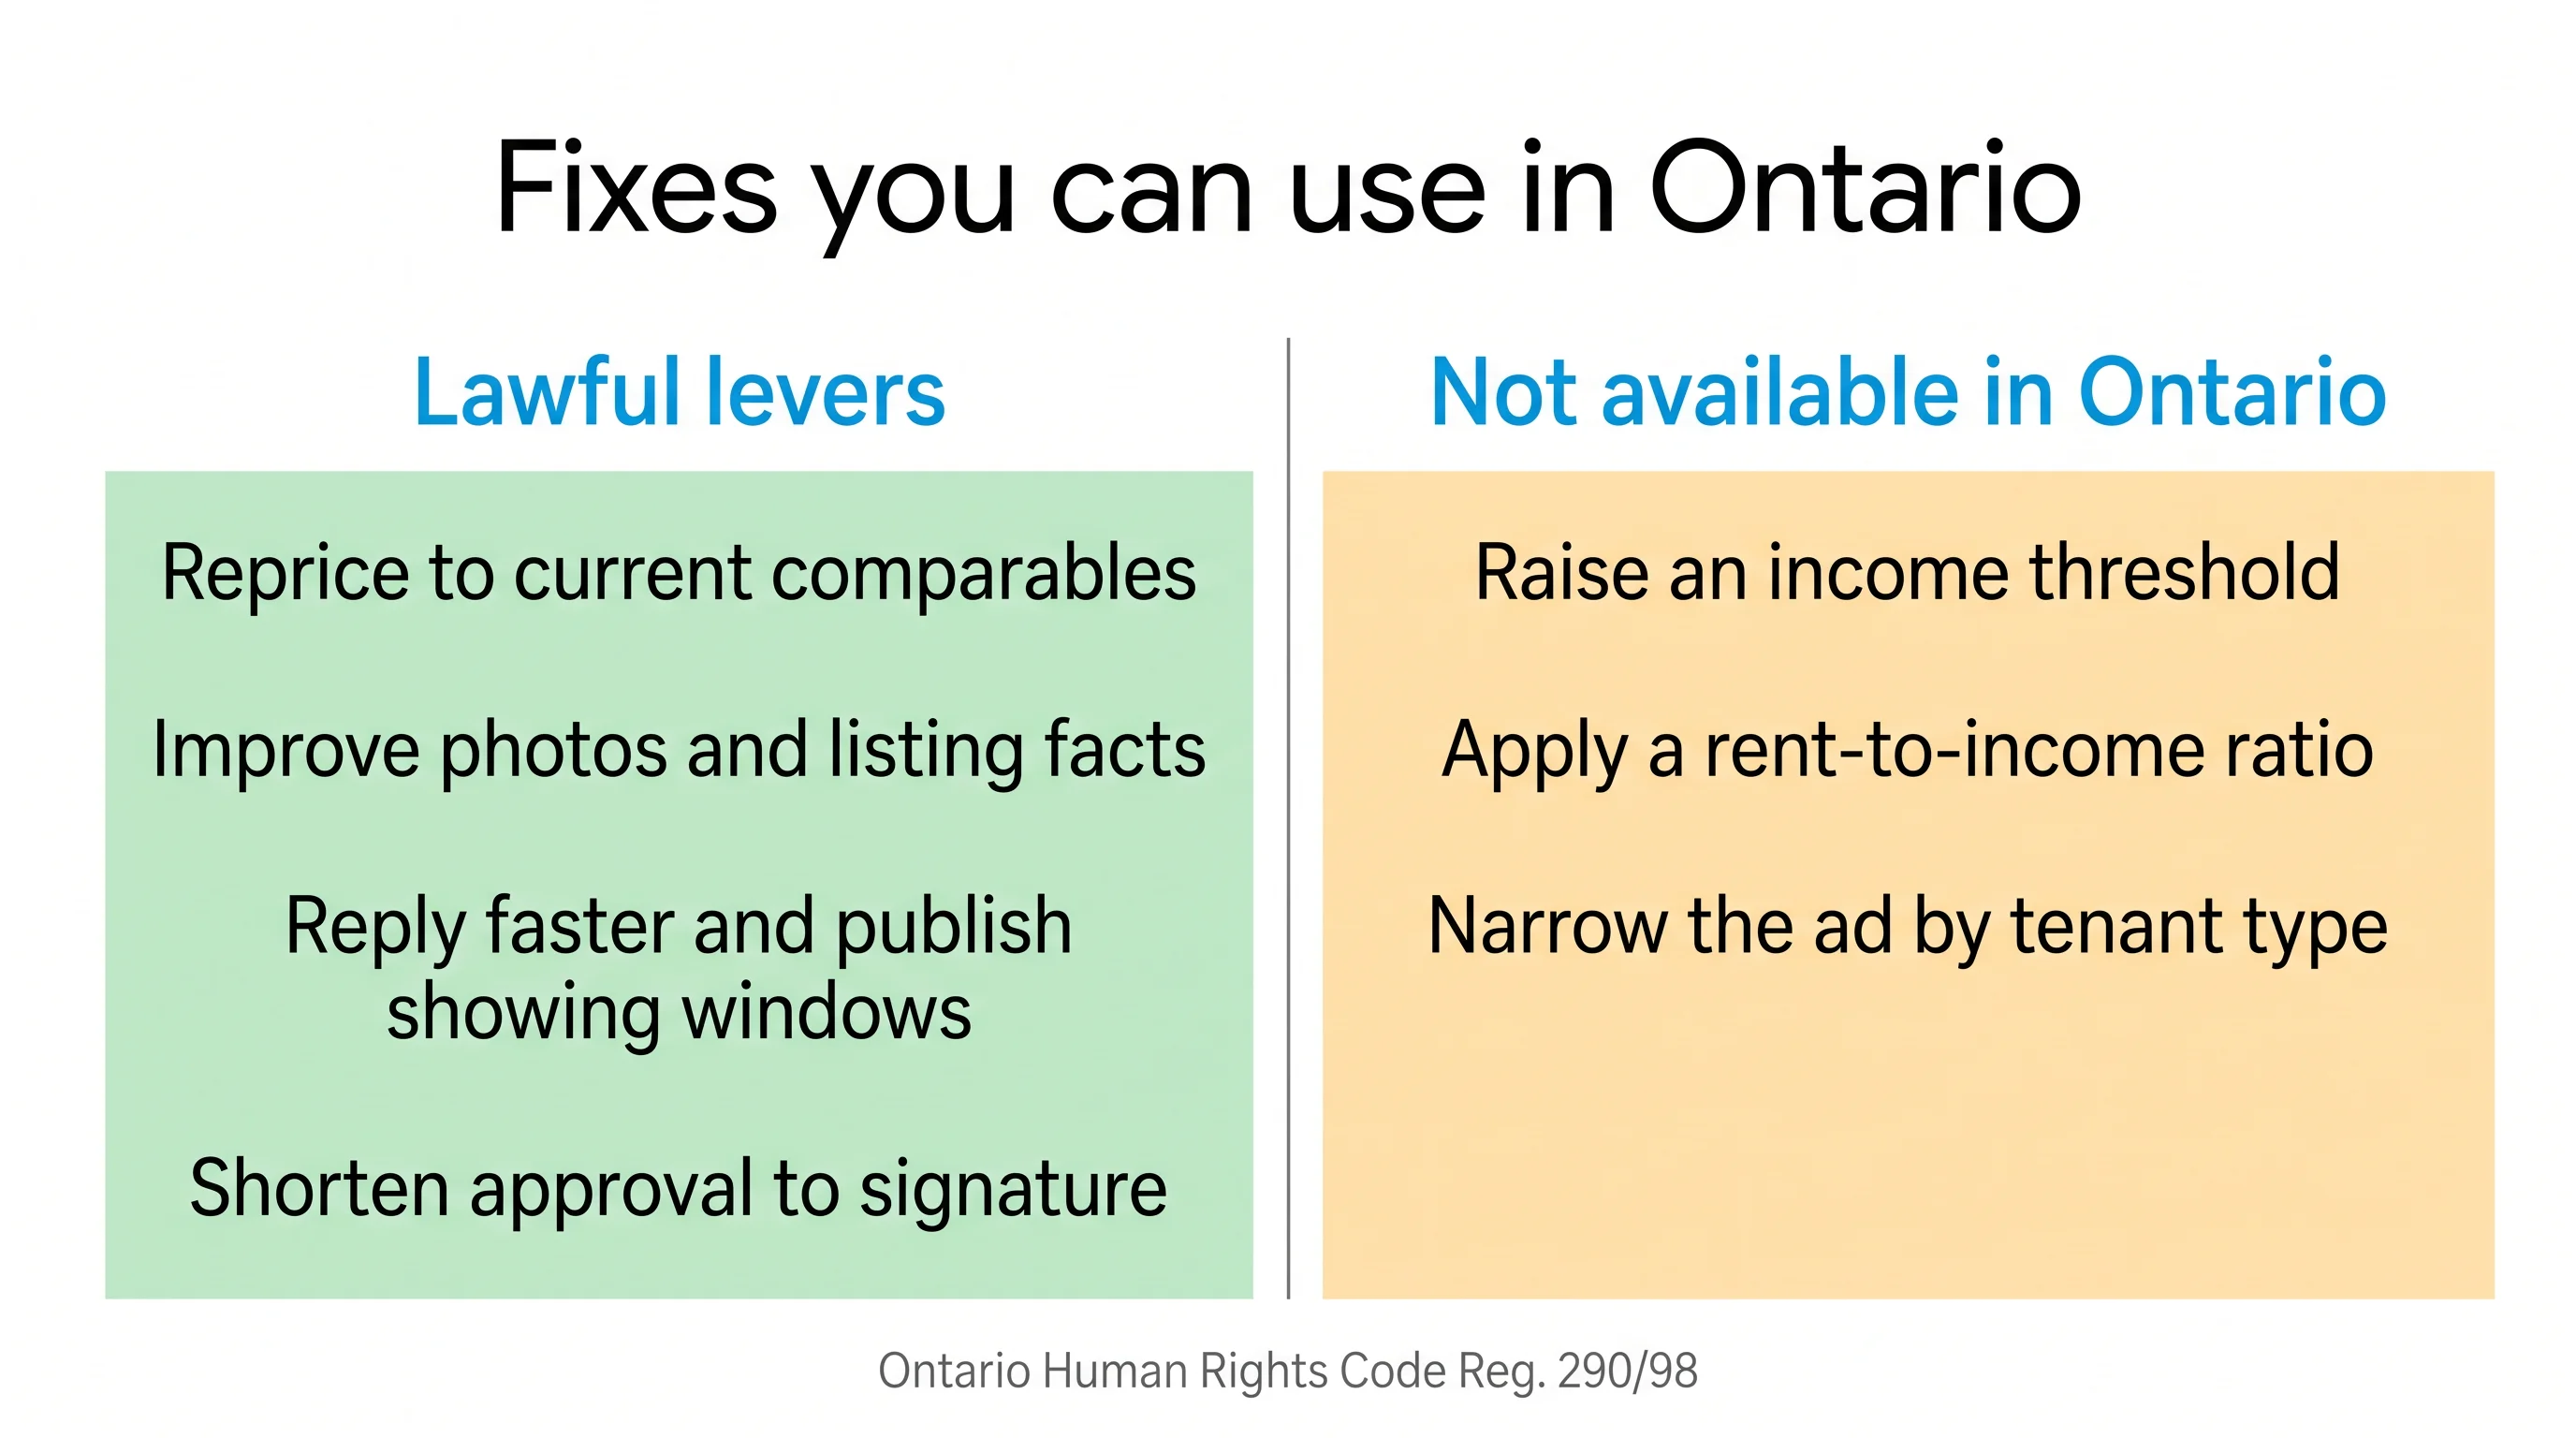
The most common stage-4 conclusion is "my applicants don't qualify," and the American funnel literature routinely recommends tightening income requirements in response. In Ontario that reasoning runs straight into Regulation 290/98 under the Human Rights Code: income information may be requested only alongside credit references, rental history and credit checks, and it must be weighed together with all of them. Rent-to-income ratios — including a 30% cut-off or a 3× rent rule — are illegal outside subsidized housing. And a lack of rental or credit history should not count against an applicant at all.
So "raise my income threshold" is not an available fix. The lawful levers are price, presentation, speed and terms — a materially smaller toolkit than the US material assumes. Our guide to what you can and can't ask a rental applicant covers the boundary in detail.
Stage 1 fixes must stay lawful too
Improving conversion by narrowing your audience is the one optimisation that can cost more than the vacancy it solves. The OHRC treats "adults only," "not suitable for children" and similar phrasing as exclusionary. Describe the unit, never the tenant — which is the method our guide to writing a rental listing that attracts good tenants is built around.
Stage 2 carries its own Code exposure
Differential response is a decision, whether or not you experience it as one. An undocumented inbox produces exactly the outcome the Code prohibits and leaves nothing behind to demonstrate otherwise — which is the second reason the log matters. The instrument that measures the stage is the same instrument that defends it.
PIPEDA applies to your tracking
Track the minimum the metric needs: a date, a stage, an outcome. Not documents, not applicant characteristics. Delete prospect-level data once the unit is leased and keep only the aggregate counts and your ratios. And do not build or share an informal record of "bad" prospects — the Privacy Commissioner has found landlords have no right to disclose that kind of information to informal lists.
The lawful fix list, by stage
- Stage 1: reprice to this month's comparables · reshoot the photographs · add the missing facts.
- Stage 2: same-day replies · published showing windows · answer the repeated question in the ad itself.
- Stage 3: close the gap between listing and reality · fix whatever visitors are reacting to.
- Stage 4: shorten approval-to-signature · consider a concession, applied equally to every applicant.
A worked example, and what's coming

One unit, twenty-one days
The following figures are illustrative — constructed to demonstrate the method rather than drawn from a real portfolio.
A Toronto one-bedroom, listed at $2,650.
- Day 7: 34 enquiries. Stage 1 is healthy — whatever else is wrong, the price is not suppressing interest.
- Day 14: 6 showings from 34 enquiries. That is 18%, against the roughly 25% benchmark. Stage 2 is soft, and the log shows replies averaging nine hours.
- Day 21: 3 applications from 6 showings. That is 50%, comfortably above the 40% benchmark. Stage 3 is fine — the unit is delivering what the listing promised.
Diagnosis: response speed, not price. The fix costs nothing — reply the same day, publish showing windows, stop negotiating twelve individual appointments. The reflex fix, dropping the rent $150, would have cost $1,800 over the lease and left the actual problem untouched. That is the entire argument for measuring, in one unit and three weeks.
What's coming over the next year
- Toronto funnels get more forgiving. Supply below its long-term average and listings down 6% means more volume per listing, so a weak stage costs opportunity rather than the tenancy.
- The 905 gets less forgiving. Falling rents and more renter choice mean one broken stage stalls a unit outright.
- The listing does more of the work. With renters typically taking one in-person tour — and about one in five taking none at all — the media-rich listing increasingly substitutes for the showing. That raises the importance of stages 1 and 3 simultaneously.
- Concessions become a stage-4 instrument. Roughly two in five listings carried a concession this spring in US data; expect "approved applicants going elsewhere" to become a more common diagnosis here too.
- Automation makes stage 2 measurable by default — and raises the Code question of what, exactly, an automated filter is filtering on.
Practical takeaways
Seven things to do differently on your next vacancy:
- Set up the five-column tracker before the listing goes live, and record the asking rent plus three current comparables.
- Log every enquiry as it arrives — date received, date replied, outcome.
- Count only completed showings and only submitted applications. Booked-and-no-showed is a different number and a different diagnosis.
- Check at day 7, day 14 and day 21, and act on the earliest failing stage rather than the most visible one.
- Measure over at least one full leasing cycle before believing any ratio.
- Never respond to a stage-4 problem with an income ratio — it is unlawful in Ontario.
- Record your four ratios at lease signing and compare against the same season next time.
Quick wins: start the tracker on your current vacancy today, calculate your enquiry-to-showing rate against the 25% benchmark, time your average reply from the log, and check the approval-to-signature gap on your last tenancy. Longer-term: build a baseline across three or four vacancies, track by unit type so you know what normal looks like for each, always compare like seasons, and keep moving the diagnosis upstream — the earliest broken stage caps everything after it.
The Leasing Funnel Tracker: Diagnose Why Your Unit Isn't Renting
Three weeks listed and no applications? Dropping the rent is the wrong lever about half the time. This free tracker gives you the four stage ratios, the day 7 / 14 / 21 checkpoints, and a five-column log that tells you exactly which stage is broken before you spend a dollar fixing the wrong one.
Get Free PDF →Frequently asked questions
Why is my rental not renting?
Because one of four stages is failing, and the ratio at each stage tells you which. If the listing has been live a week with almost no enquiries, the price or the photos are the problem. If enquiries arrive but nobody books a showing, it is usually response speed. If people tour and don't apply, the unit is underdelivering against the listing. If approved applicants disappear, it is speed or terms. Dropping the rent fixes only the first of those.
How many enquiries or views should a rental listing get?
No Canadian body publishes that figure, and it varies enormously by segment. A well-priced Toronto one-bedroom on a free platform in summer can draw forty enquiries in a weekend; a new-build studio near a campus in January might draw eight. The useful measure is not the count but the ratios between stages, which are far more stable than the absolute numbers.
Should I lower the rent or wait?
Check stage 1 first. If you are getting enquiries, the price is not obviously wrong and repricing may fix nothing. If enquiries are near zero after a week at peak season, the price or the photographs are the likely cause. On a $2,577 unit, three weeks of guessing costs about $1,785 in vacancy — the diagnosis is cheaper than the experiment.
What does it mean when people tour but don't apply?
Your showing-to-application rate is below the roughly 40% US benchmark, which usually means the unit is underdelivering against what the listing promised. Something visitors encounter in person is not in the ad. That is a listing accuracy problem more often than a unit problem, and it is fixable without touching the rent.
How long should I track a listing before drawing conclusions?
At least one full leasing cycle — 30 to 45 days from first enquiry to signature. Measuring over a single week compares this week's enquiries against leases from weeks earlier, which are different cohorts and produce meaningless ratios. And one vacancy gives you an indication, not a baseline; three or four give you something to trust.
The bottom line
A stalled listing has a broken stage, and the stage has a number. Views without enquiries is price or presentation. Enquiries without showings is response. Showings without applications is the gap between the ad and the unit. Applications without a lease is speed or terms. Nobody in Canada publishes the benchmarks, so the ratios have to come from your own units — which takes a spreadsheet and about two minutes per enquiry.
The value here is not the benchmark. It is knowing which question you are answering. A landlord who drops the rent when the real problem was a nine-hour reply time has spent $1,800 and fixed nothing — and will do the same thing on the next vacancy, because they still do not know what actually happened. Measuring once means never guessing again.
Next steps: start the tracker on your current vacancy, calculate your enquiry-to-showing rate, and check your approval-to-signature gap on the last tenancy you signed.
Three of the four stages diagnose back to your listing
Tenon10's listing builder covers the facts tenants filter by, Human Rights Code-safe language, and the lawful money lines — so stages 1 and 3 are right before you publish, not diagnosed three weeks later.
Free • No signup required • Updated for the Bill 60 changes in force 21 Sep 2026
Related resources
- How Long Does It Take to Rent a Unit in Ontario? — where the 27-day outer clock comes from, and why no official days-on-market figure exists.
- What an Empty Unit Actually Costs You Per Day — the full vacancy-cost model behind the $85-a-day figure.
- How to Write a Rental Listing That Attracts Good Tenants — the fix for stages 1 and 3, written before you need it.
- Where to List a Rental in Ontario: 9 Sites Compared — which platforms produce volume, and which produce noise.
- How to Screen a Tenant in Ontario: The 7-Step Method — the sequence that starts where stage 4 begins.
- What You Can and Can't Ask a Rental Applicant in Ontario — the boundary that makes an income-threshold fix unavailable.
- Free Rental Listing Tools for Ontario Landlords — the honest toolkit for each job in the listing workflow.
This article is general information, not legal advice. All figures are current as of August 2026 and carry their original source and date. Benchmarks marked US are American multifamily portfolio data and are labelled as such throughout. The worked example is illustrative. Verify current rules at ontario.ca, ohrc.on.ca, or with the Landlord and Tenant Board.


